Arduino Trình vẽ đồ thị trên web

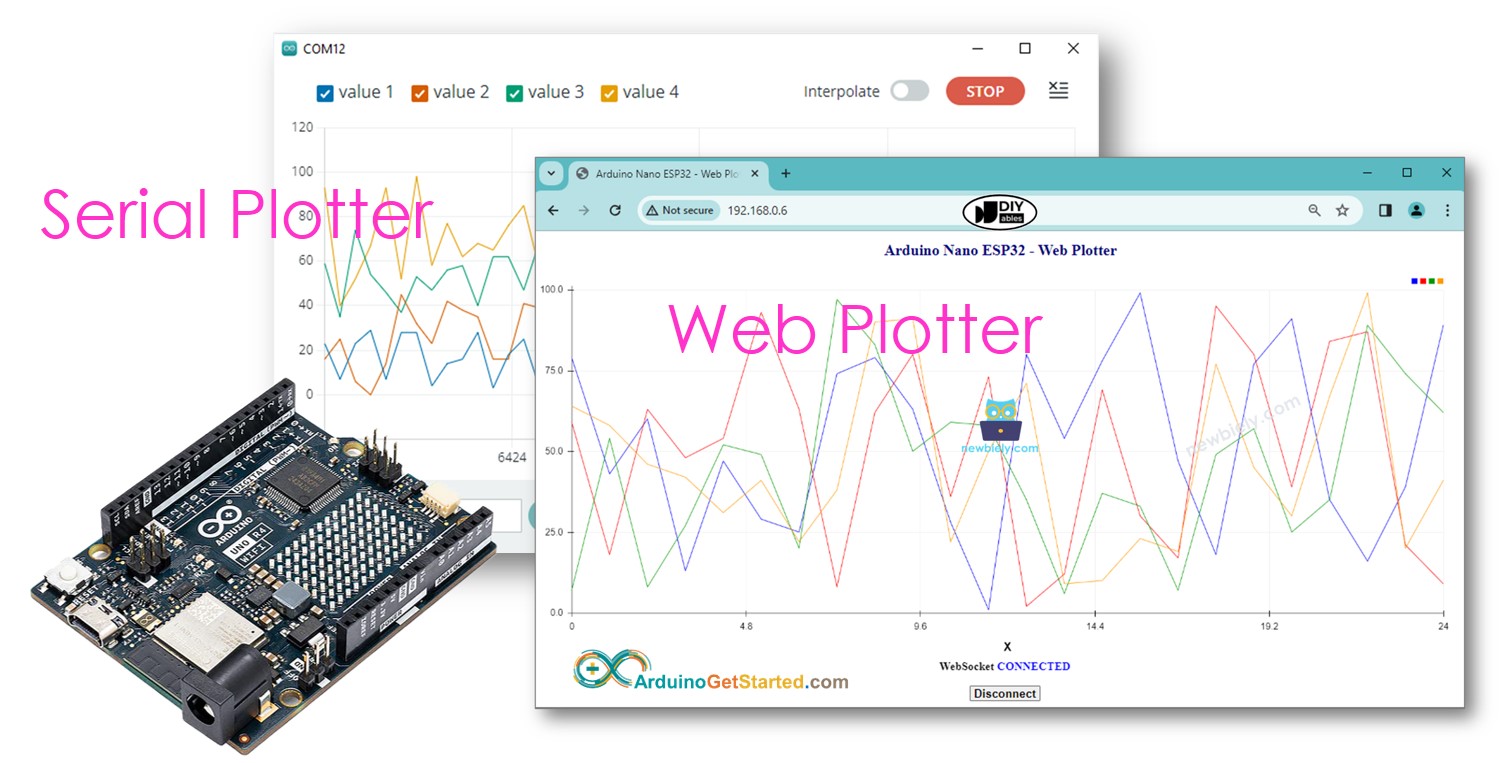
Trong hướng dẫn này, chúng ta sẽ học cách xây dựng một plotter trên web trông giống với Arduino - Trình vẽ đồ thị nối tiếp trong Arduino IDE. Với hệ thống này, bạn có thể dễ dàng theo dõi dữ liệu thời gian thực từ Arduino bằng trình duyệt web trên điện thoại thông minh hoặc máy tính của bạn. Dữ liệu sẽ được hiển thị ở định dạng đồ thị, tương tự như những gì bạn thấy trong Serial Plotter ở Arduino IDE.

trình vẽ đồ thị trên web cho Arduino

Phần cứng cần chuẩn bị
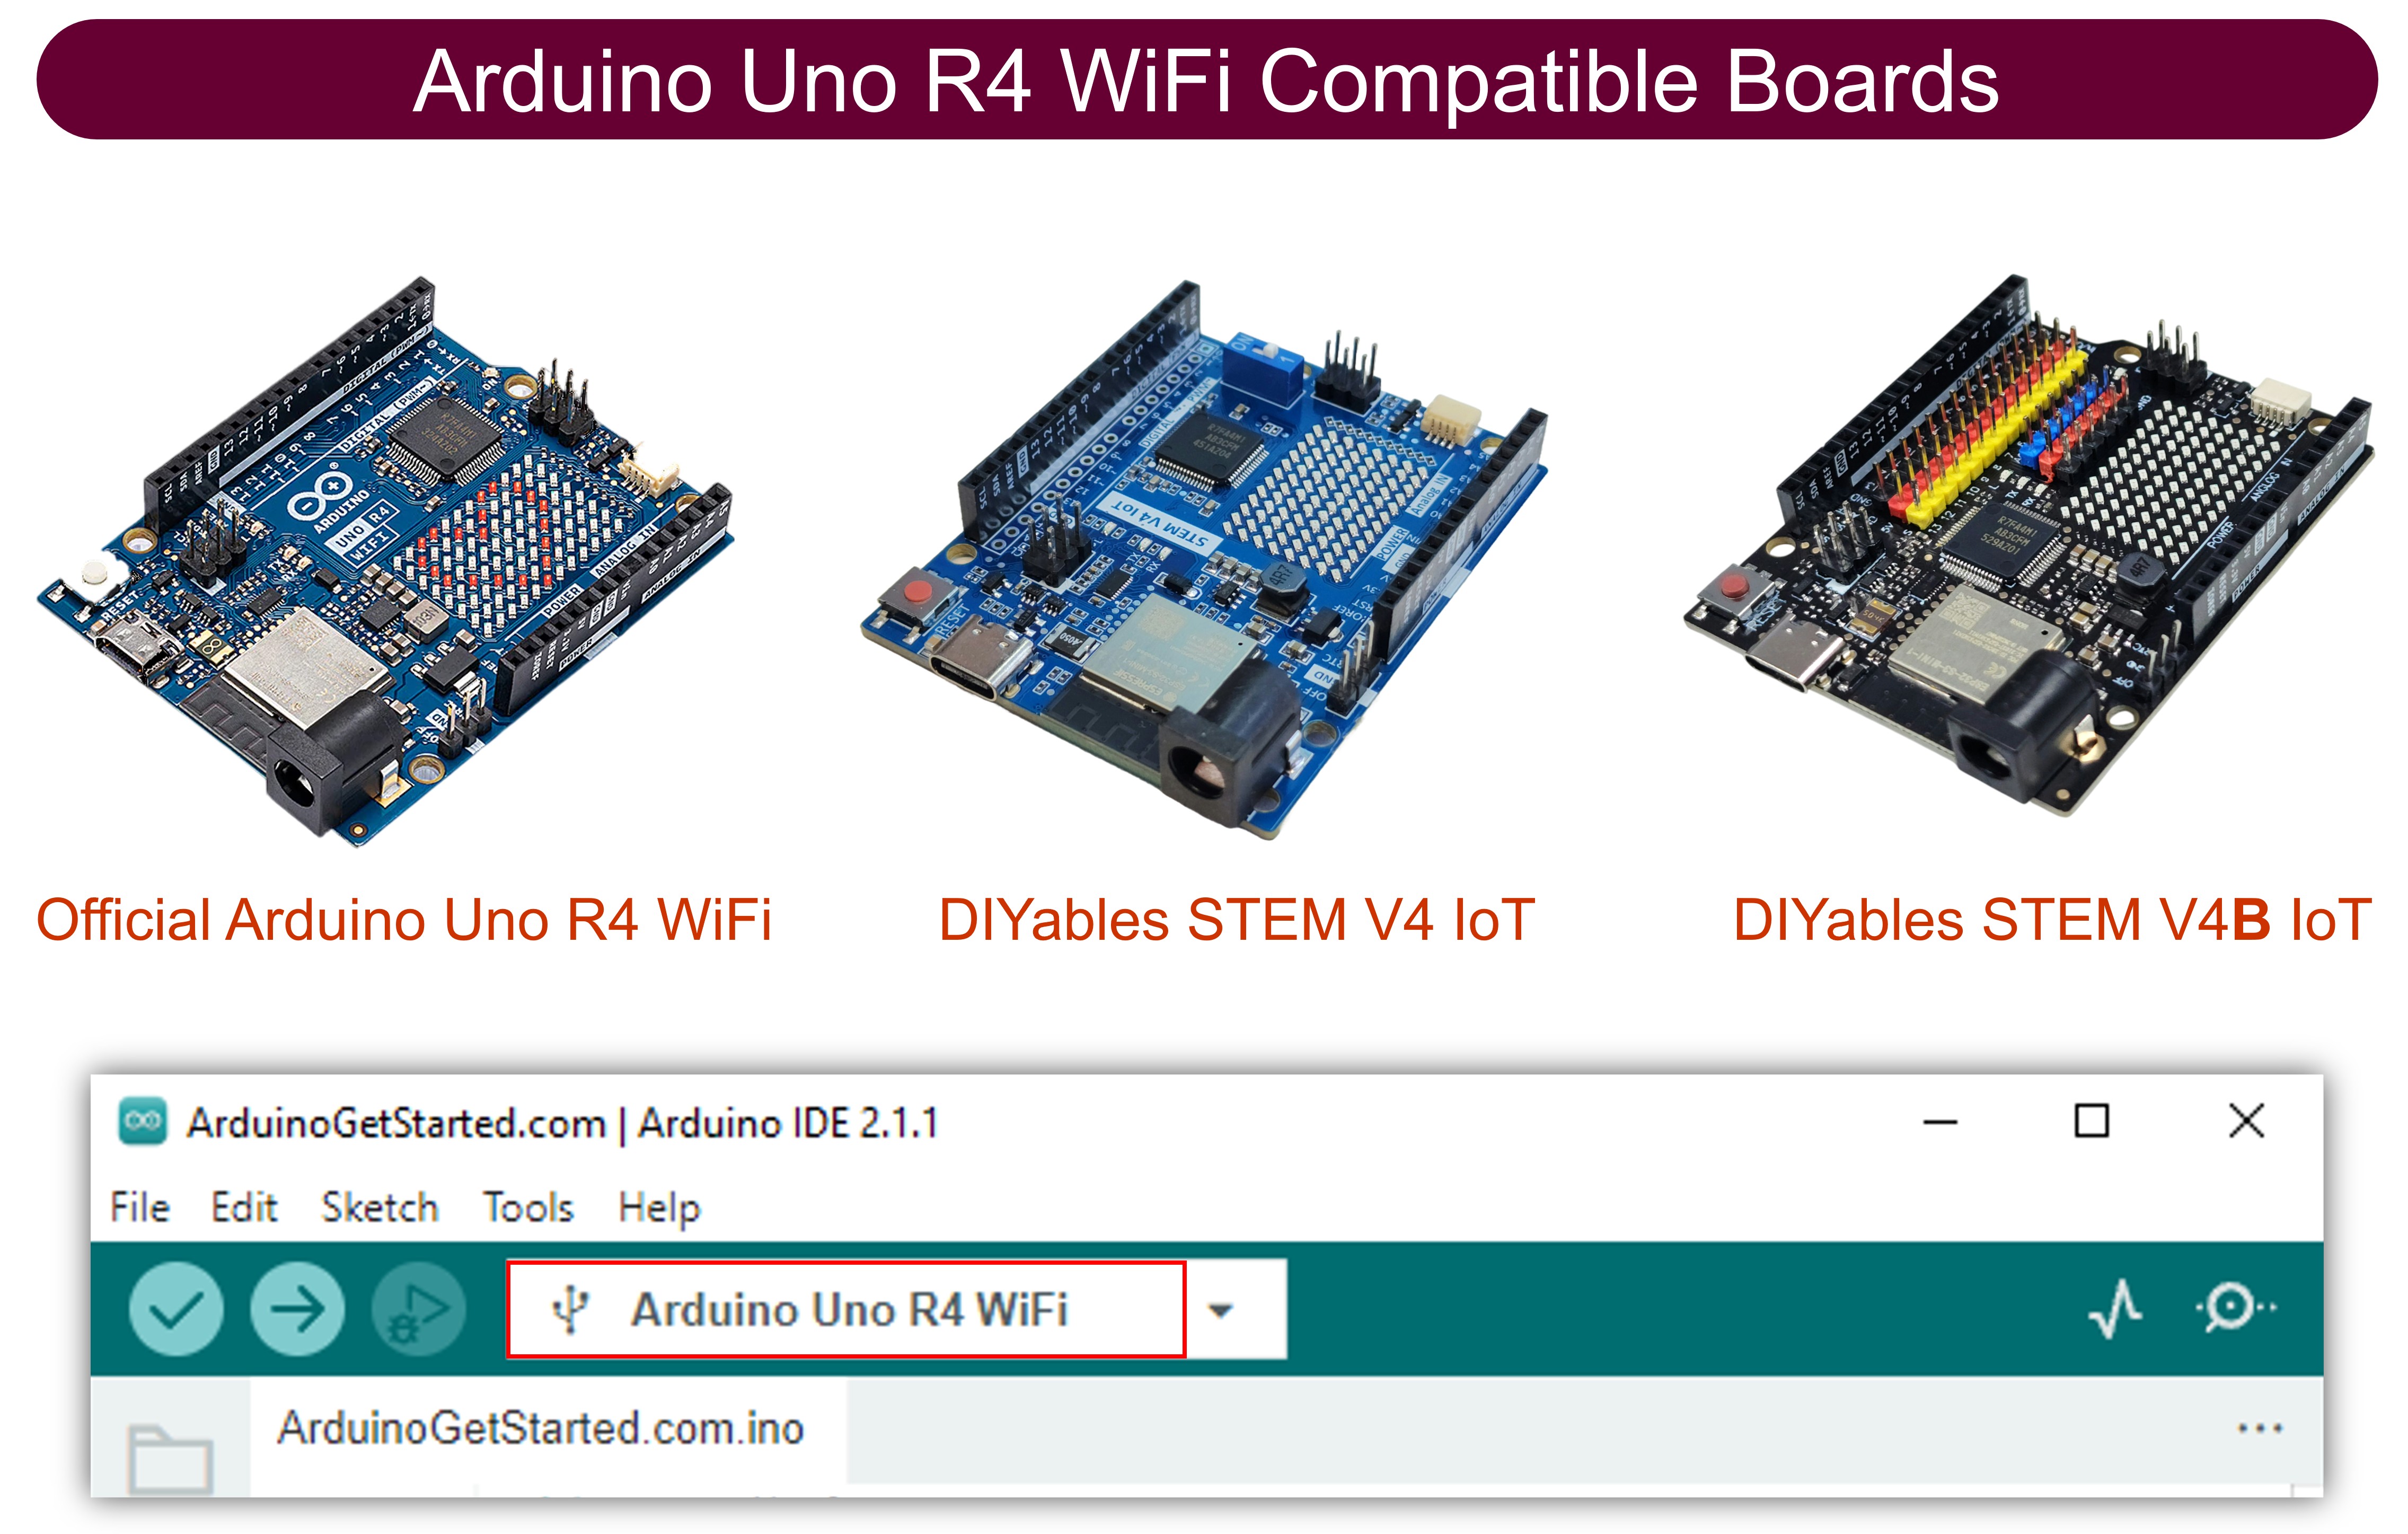
1×Arduino UNO R4 WiFi
1×Alternatively, DIYables STEM V4 IoT
1×(Tùy chọn) DIYables STEM V4 IoT
1×USB Cable Type-A to Type-C (for USB-A PC)
1×USB Cable Type-C to Type-C (for USB-C PC)
1×(Khuyến nghị) Screw Terminal Block Shield for Arduino UNO R4
1×(Khuyến nghị) Breadboard Shield for Arduino UNO R4
1×(Khuyến nghị) Enclosure for Arduino UNO R4
1×(Khuyến nghị) Power Splitter for Arduino UNO R4
1×(Khuyến nghị) Prototyping Base Plate & Breadboard Kit for Arduino UNO

Or you can buy the following kits:

1×DIYables STEM V4 IoT Starter Kit (Arduino included)
1×DIYables Sensor Kit (30 sensors/displays)
1×DIYables Sensor Kit (18 sensors/displays)

Cách Web Plotter hoạt động

Đây là cách mà quá trình hoạt động:

  • Mã Arduino thiết lập đồng thời một máy chủ web và một máy chủ WebSocket.
  • Khi người dùng truy cập trang web được lưu trữ trên bảng Arduino thông qua trình duyệt, máy chủ web sẽ trả về nội dung trang (HTML, CSS, JavaScript) cho trình duyệt.
  • Mã JavaScript trên trang web tạo ra một đồ thị giống Serial Plotter.
  • Khi người dùng nhấn nút kết nối trên trang web, mã JavaScript thiết lập một kết nối WebSocket với máy chủ WebSocket trên bảng Arduino.
  • Arduino gửi dữ liệu cho trình duyệt web thông qua kết nối WebSocket này theo một định dạng tương tự như định dạng được Serial Plotter sử dụng (chi tiết ở phần tiếp theo).
  • Mã JavaScript trong trình duyệt nhận dữ liệu này và vẽ nó lên đồ thị.

Định dạng dữ liệu mà Arduino gửi cho máy plotter trên web

Để vẽ đồ thị nhiều biến, chúng ta cần tách các biến với nhau bằng ký tự “\t” hoặc ký tự khoảng trắng. Giá trị cuối cùng phải được kết thúc bằng các ký tự “\r\n”.

Chi tiết:

  • Biến đầu tiên
webSocket->broadcastTXT(variable_1);
  • Các biến ở giữa
webSocket->broadcastTXT(" "); // a tab '\t' or space ' ' character is printed between the two values. webSocket->broadcastTXT(variable_2); webSocket->broadcastTXT(" "); // a tab '\t' or space ' ' character is printed between the two values. webSocket->broadcastTXT(variable_3);
  • Biến cuối cùng
webSocket->broadcastTXT(" "); // a tab '\t' or space ' ' character is printed between the two values. webSocket->broadcastTXT(variable_4); webSocket->broadcastTXT("\r\n"); // the last value is terminated by a carriage return and a newline characters.

Để biết thêm chi tiết, vui lòng tham khảo Arduino - Trình vẽ đồ thị nối tiếp hướng dẫn

Mã Arduino - Web Plotter

Nội dung của trang web (HTML, CSS, JavaScript) được lưu trữ riêng biệt trong một tệp index.h. Vì vậy, chúng ta sẽ có hai tệp mã nguồn trên Arduino IDE:

  • Một file .ino chứa mã Arduino, tạo ra một máy chủ web và một máy chủ WebSocket
  • Một file .h, chứa nội dung của trang web.

Hướng dẫn từng bước

  • Nếu đây là lần đầu tiên bạn sử dụng Arduino Uno R4, hãy xem Cách bắt đầu với Arduino UNO R4.
  • Kết nối bo mạch Arduino với máy tính của bạn bằng cáp micro USB.
  • Mở Arduino IDE trên máy tính của bạn.
  • Chọn bo mạch Arduino phù hợp (Arduino Uno R4 WiFi) và cổng COM.
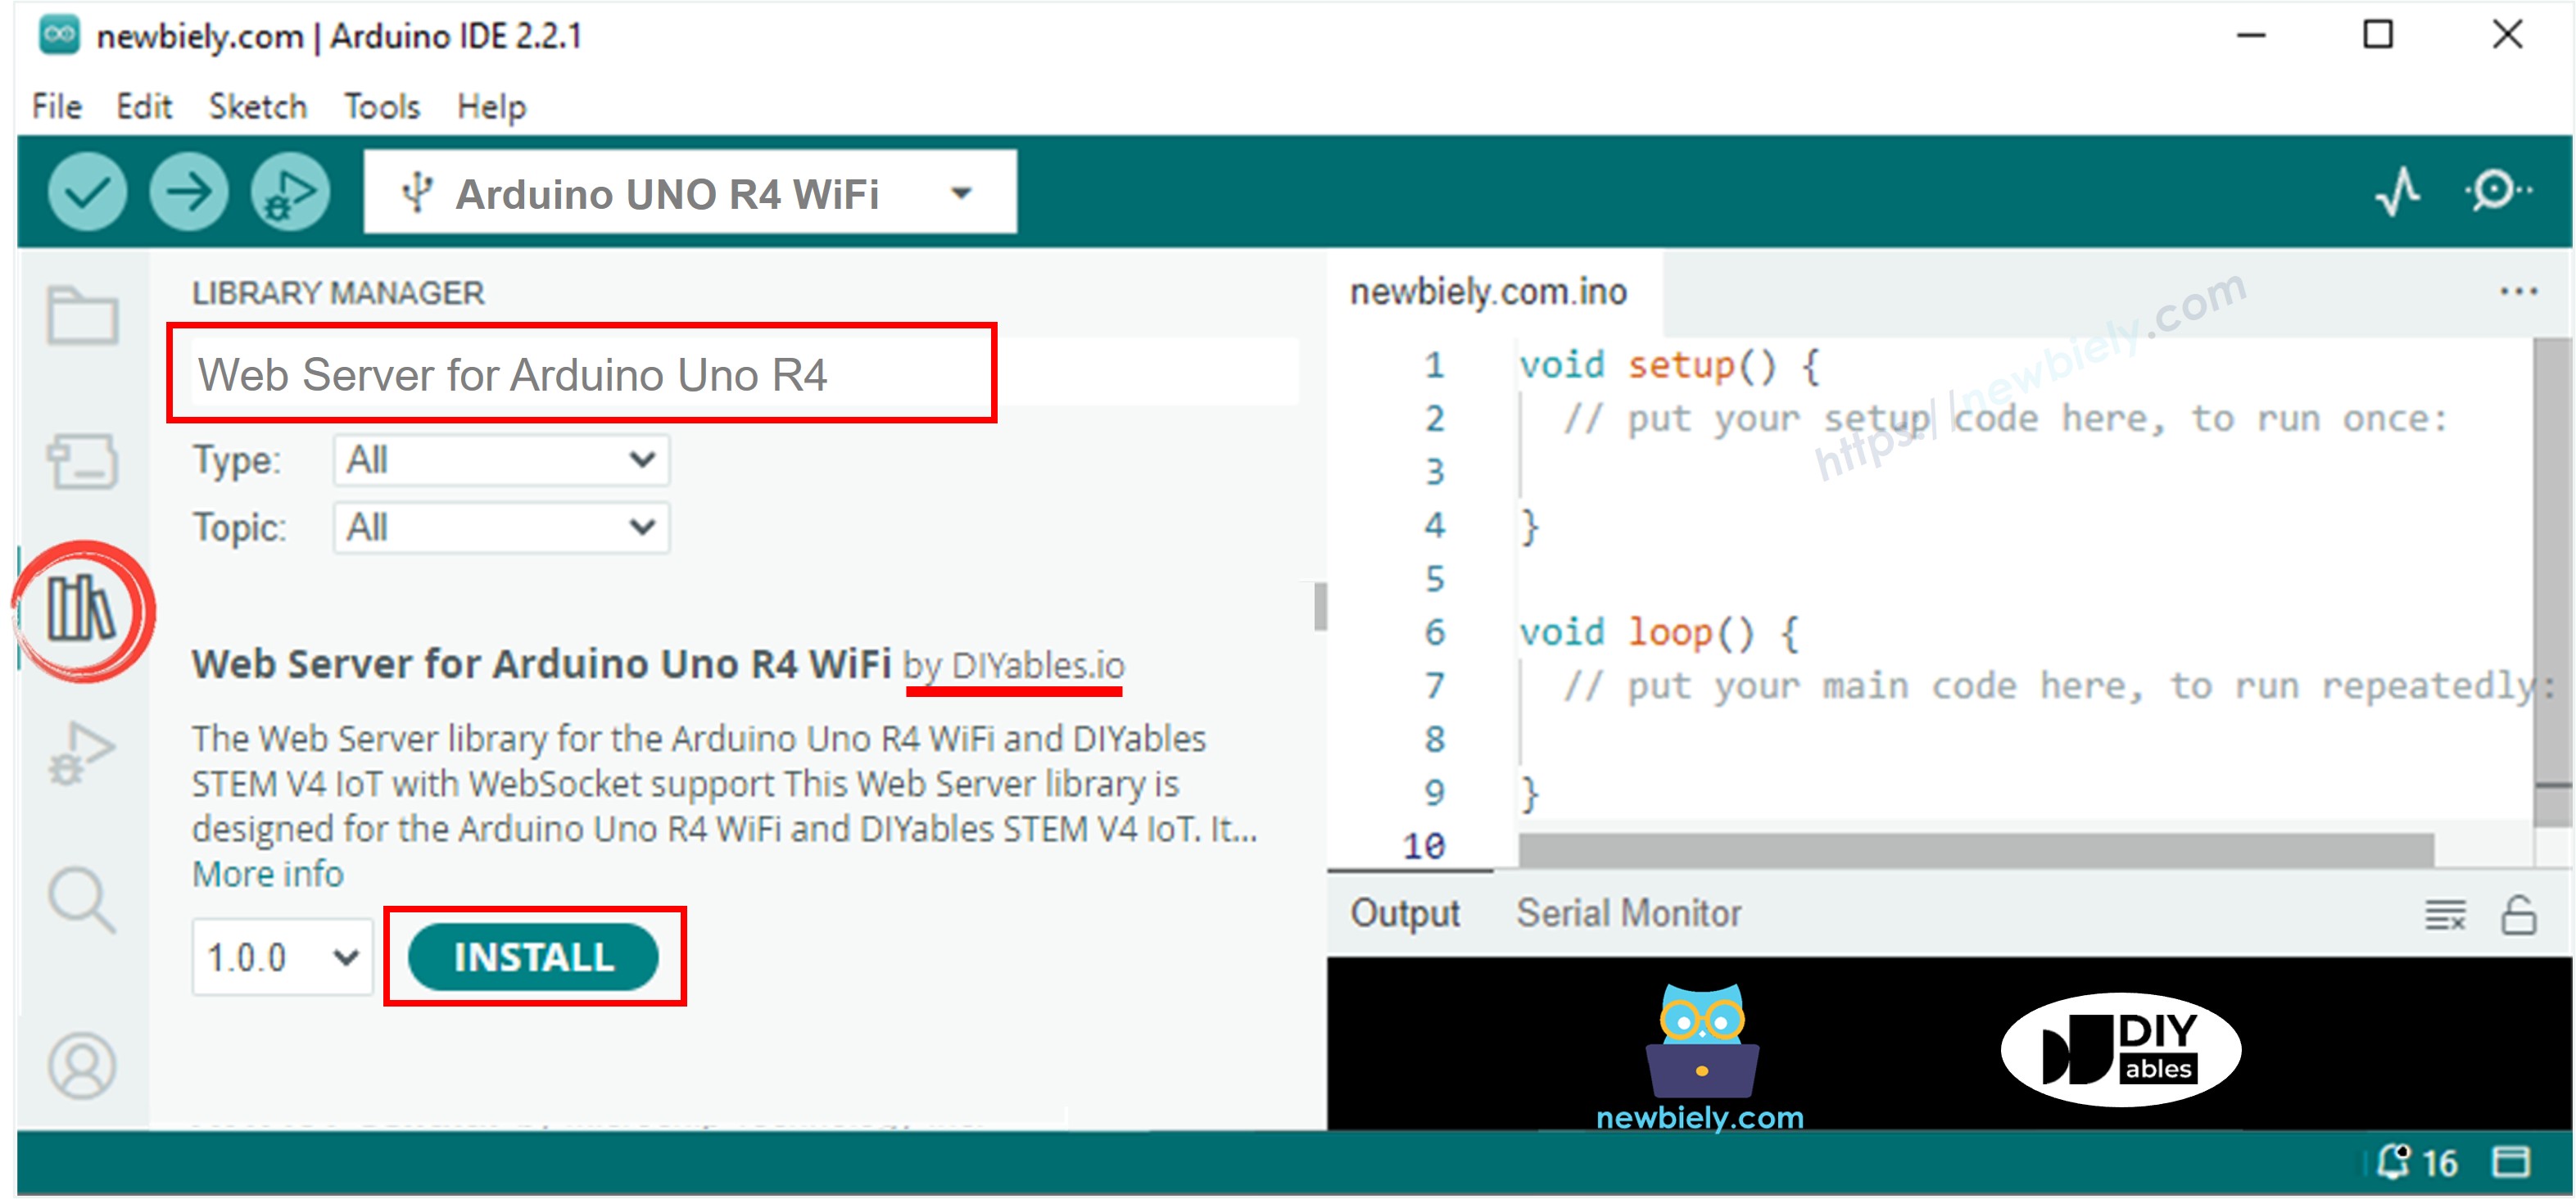
  • Mở Trình quản lý thư viện bằng cách nhấp vào biểu tượng Trình quản lý thư viện ở thanh điều hướng bên trái của Arduino IDE.
  • Tìm kiếm Web Server for Arduino Uno R4 WiFi và tìm thư viện Web Server do DIYables tạo ra.
  • Nhấp nút Cài đặt để cài đặt thư viện Web Server.
thư viện máy chủ web cho Arduino UNO R4
  • Trên Arduino IDE, tạo một sketch mới, đặt cho nó một tên, ví dụ, ArduinoGetStarted.com.ino
  • Sao chép mã dưới đây và mở bằng Arduino IDE
/* * Mã Arduino này được phát triển bởi newbiely.vn * Mã Arduino này được cung cấp để sử dụng công khai, không có ràng buộc. * Để xem hướng dẫn chi tiết và sơ đồ kết nối, vui lòng truy cập: * https://newbiely.vn/tutorials/arduino/arduino-web-plotter */ #include <UnoR4WiFi_WebServer.h> #include "index.h" // WiFi credentials const char WIFI_SSID[] = "YOUR_WIFI_SSID"; const char WIFI_PASSWORD[] = "YOUR_WIFI_PASSWORD"; // Create web server instance UnoR4WiFi_WebServer server(80); UnoR4WiFi_WebSocket* webSocket; int last_update = 0; // Page handlers void handleHome(WiFiClient& client, const String& method, const String& request, const QueryParams& params, const String& jsonData) { server.sendResponse(client, HTML_CONTENT); } // WebSocket event handlers void onWebSocketOpen(net::WebSocket& ws) { Serial.println("New WebSocket connection"); } void onWebSocketMessage(net::WebSocket& ws, const net::WebSocket::DataType dataType, const char* message, uint16_t length) { // no message from plotter } void onWebSocketClose(net::WebSocket& ws, const net::WebSocket::CloseCode code, const char* reason, uint16_t length) { Serial.println("WebSocket client disconnected"); } void setup() { Serial.begin(9600); delay(1000); // TO DO Serial.println("Arduino Uno R4 WiFi - WebSocket Server"); // Configure web server routes server.addRoute("/", handleHome); // Start web server with WiFi connection server.begin(WIFI_SSID, WIFI_PASSWORD); // Enable WebSocket functionality webSocket = server.enableWebSocket(81); if (webSocket != nullptr) { // Set up WebSocket event handlers webSocket->onOpen(onWebSocketOpen); webSocket->onMessage(onWebSocketMessage); webSocket->onClose(onWebSocketClose); } else { Serial.println("Failed to start WebSocket server"); } } void loop() { // Handle HTTP requests and WebSocket connections using the library server.handleClient(); server.handleWebSocket(); if (millis() - last_update > 500) { last_update = millis(); String variable_1 = String(random(0, 100)); String variable_2 = String(random(0, 100)); String variable_3 = String(random(0, 100)); String variable_4 = String(random(0, 100)); // TO SERIAL PLOTTER Serial.print(variable_1); Serial.print(" "); // a tab '\t' or space ' ' character is printed between the two values. Serial.print(variable_2); Serial.print(" "); // a tab '\t' or space ' ' character is printed between the two values. Serial.print(variable_3); Serial.print(" "); // a tab '\t' or space ' ' character is printed between the two values. Serial.println(variable_4); // the last value is terminated by a carriage return and a newline characters. // TO WEB PLOTTER webSocket->broadcastTXT(variable_1); webSocket->broadcastTXT(" "); // a tab '\t' or space ' ' character is printed between the two values. webSocket->broadcastTXT(variable_2); webSocket->broadcastTXT(" "); // a tab '\t' or space ' ' character is printed between the two values. webSocket->broadcastTXT(variable_3); webSocket->broadcastTXT(" "); // a tab '\t' or space ' ' character is printed between the two values. webSocket->broadcastTXT(variable_4); webSocket->broadcastTXT("\r\n"); // the last value is terminated by a carriage return and a newline characters. } delay(10); }
  • Chỉnh sửa thông tin WiFi (SSID và mật khẩu) trong mã nguồn cho phù hợp với thông tin mạng của bạn.
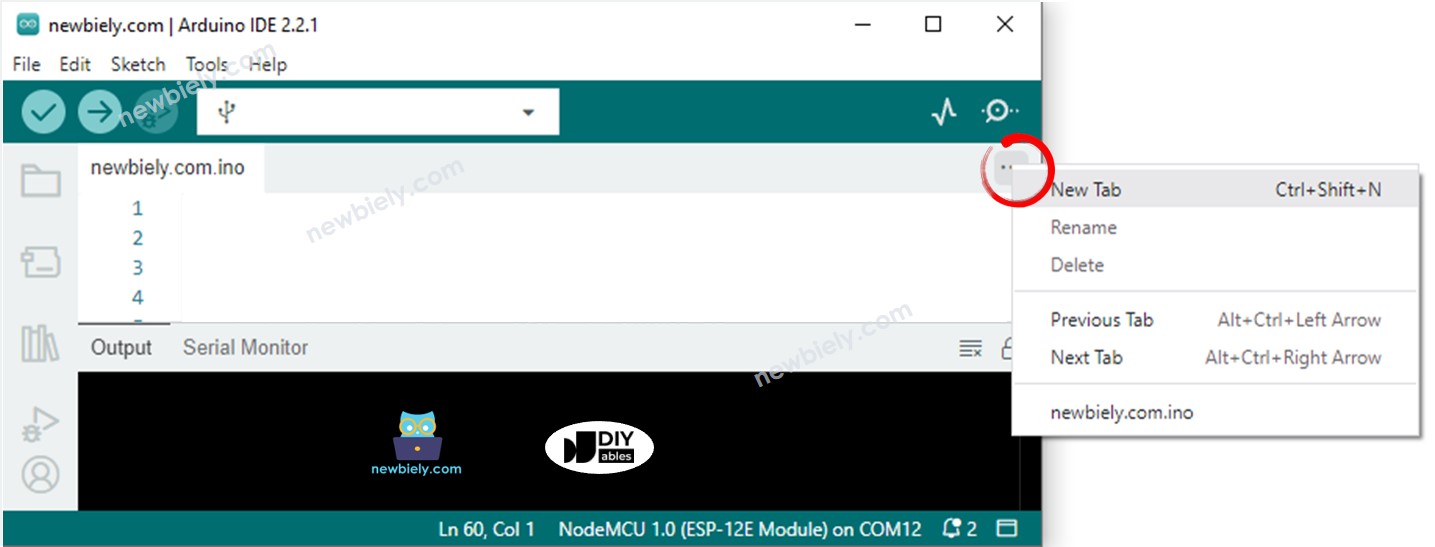
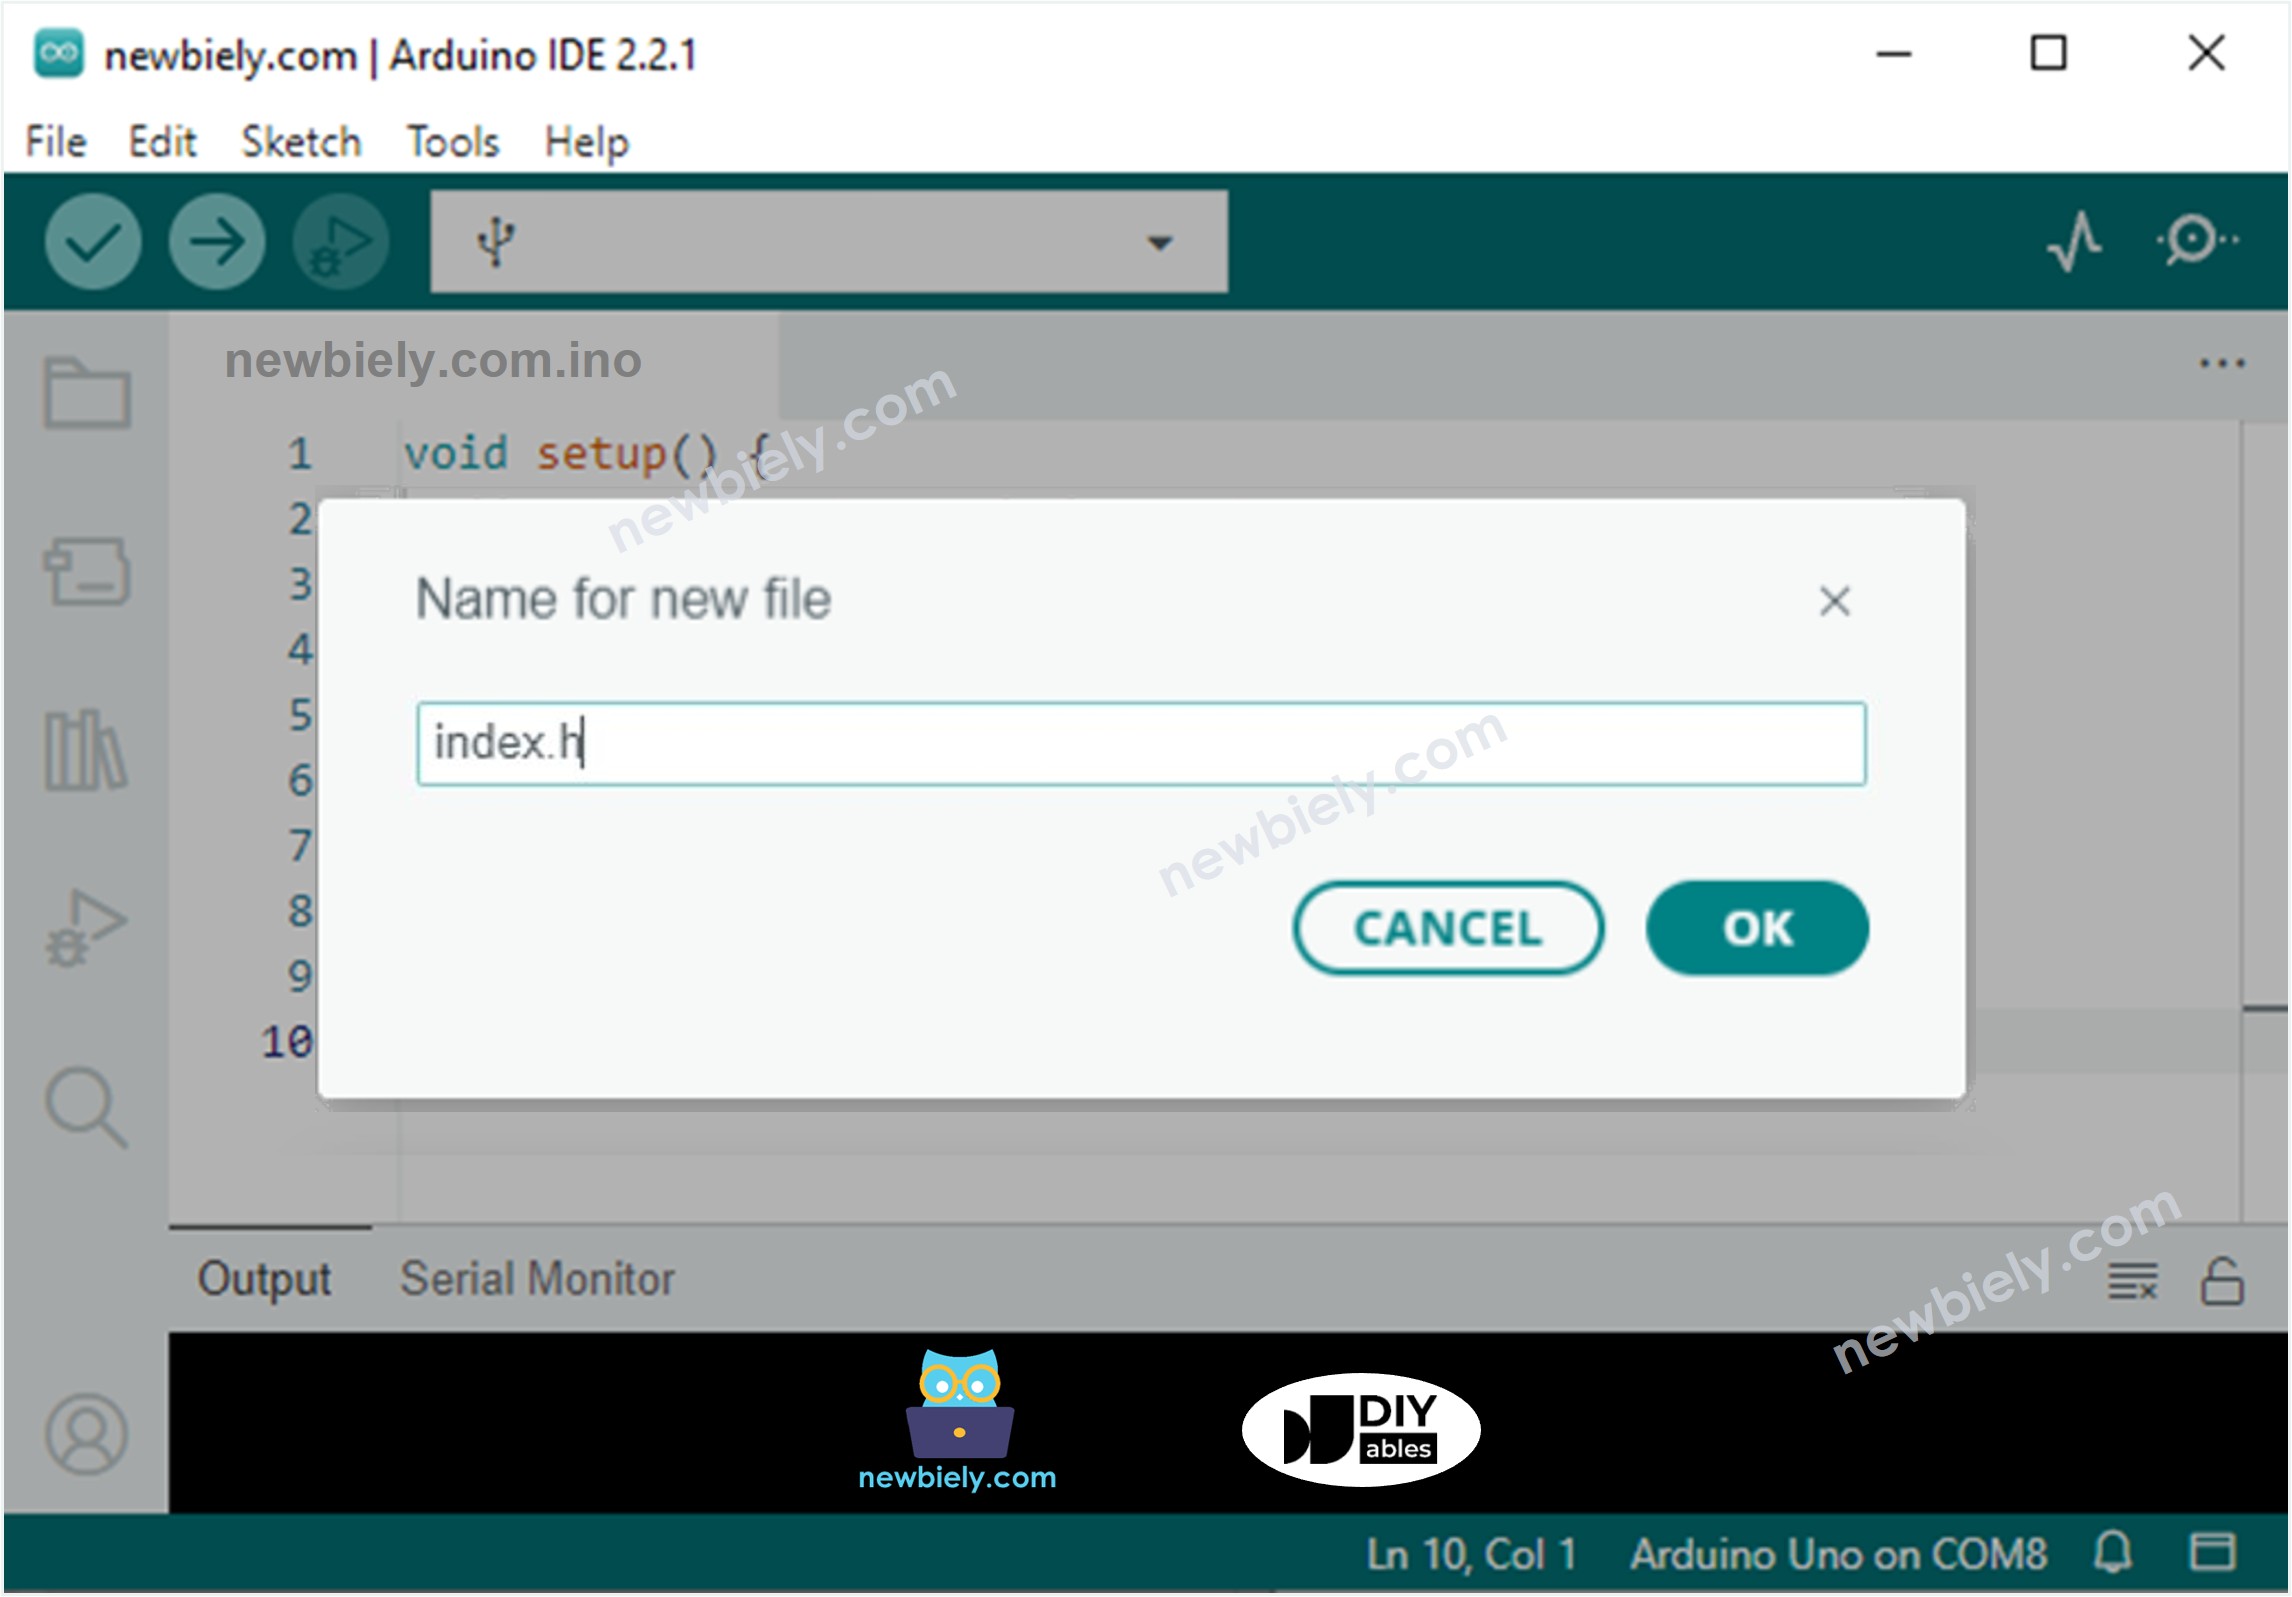
  • Tạo tệp index.h trong Arduino IDE bằng cách:
    • Nhấp vào nút ngay bên dưới biểu tượng Serial Monitor và chọn New Tab, hoặc dùng phím Ctrl+Shift+N.
    Arduino ide 2 thêm tệp
    • Đặt tên cho file index.h và nhấp OK nút
    Arduino ide 2 thêm tệp index.h
    • Sao chép đoạn mã dưới đây và dán vào file index.h.
    /* * Mã Arduino này được phát triển bởi newbiely.vn * Mã Arduino này được cung cấp để sử dụng công khai, không có ràng buộc. * Để xem hướng dẫn chi tiết và sơ đồ kết nối, vui lòng truy cập: * https://newbiely.vn/tutorials/arduino/arduino-web-plotter */ const char *HTML_CONTENT = R"=====( <!DOCTYPE html> <html> <head> <title>Arduino - Web Plotter</title> <meta name="viewport" content="width=device-width, initial-scale=0.7"> <style> body {text-align: center; height: 750px; } h1 {font-weight: bold; font-size: 20pt; padding-bottom: 5px; color: navy; } h2 {font-weight: bold; font-size: 15pt; padding-bottom: 5px; } button {font-weight: bold; font-size: 15pt; } #footer {width: 100%; margin: 0px; padding: 0px 0px 10px 0px; bottom: 0px; } .sub-footer {margin: 0 auto; position: relative; width:400px; } .sub-footer a {position: absolute; font-size: 10pt; top: 3px; } </style> <script> var COLOR_BACKGROUND = "#FFFFFF"; var COLOR_TEXT = "#000000"; var COLOR_BOUND = "#000000"; var COLOR_GRIDLINE = "#F0F0F0"; //var COLOR_LINE = ["#33FFFF", "#FF00FF", "#FF0000", "#FF8C00", "#00FF00"]; //var COLOR_LINE = ["#0000FF", "#FF0000", "#00FF00", "#FF8C00", "#00FF00"]; //var COLOR_LINE = ["#33FFFF", "#FF0000", "#00FF00", "#FF8C00", "#00FF00"]; var COLOR_LINE = ["#0000FF", "#FF0000", "#009900", "#FF9900", "#CC00CC", "#666666", "#00CCFF", "#000000"]; var LEGEND_WIDTH = 10; var X_AXIS_TITLE_HEIGHT = 40; var Y_AXIS_TITLE_WIDTH = 40; var X_AXIS_VALUE_HEIGHT = 40; var Y_AXIS_VALUE_WIDTH = 50; var PLOT_AREA_PADDING_TOP = 30; var PLOT_AREA_PADDING_RIGHT = 30; var X_GRIDLINE_NUM = 5; var Y_GRIDLINE_NUM = 4; var WSP_SIZE_TYPE = 1; /* 0: Fixed size, 1: full screen */ var WSP_WIDTH = 400; var WSP_HEIGHT = 200; var MAX_SAMPLE = 50; // in sample var X_AXIS_MIN = 0; var X_AXIS_MAX = MAX_SAMPLE; var Y_AXIS_AUTO_SCALE = 1; /* 0: y axis fixed range, 1: y axis auto scale */ var Y_AXIS_MIN = -5; var Y_AXIS_MAX = 5; var X_AXIS_TITLE = "X"; var Y_AXIS_TITLE = "Y"; var plot_area_width; var plot_area_height; var plot_area_pivot_x; var plot_area_pivot_y; var sample_count = 0; var buffer = ""; var data = []; var ws; var canvas; var ctx; function init() { canvas = document.getElementById("graph"); canvas.style.backgroundColor = COLOR_BACKGROUND; ctx = canvas.getContext("2d"); canvas_resize(); setInterval(update_view, 1000 / 60); } function connect_onclick() { if(ws == null) { ws = new WebSocket("ws://" + window.location.host + ":81"); document.getElementById("ws_state").innerHTML = "CONNECTING"; ws.onopen = ws_onopen; ws.onclose = ws_onclose; ws.onmessage = ws_onmessage; ws.binaryType = "arraybuffer"; } else ws.close(); } function ws_onopen() { document.getElementById("ws_state").innerHTML = "<span style='color: blue'>CONNECTED</span>"; document.getElementById("bt_connect").innerHTML = "Disconnect"; } function ws_onclose() { document.getElementById("ws_state").innerHTML = "<span style='color: gray'>CLOSED</span>"; document.getElementById("bt_connect").innerHTML = "Connect"; ws.onopen = null; ws.onclose = null; ws.onmessage = null; ws = null; } function ws_onmessage(e_msg) { e_msg = e_msg || window.event; // MessageEvent console.log(e_msg.data); buffer += e_msg.data; buffer = buffer.replace(/\r\n/g, "\n"); buffer = buffer.replace(/\r/g, "\n"); while(buffer.indexOf("\n") == 0) buffer = buffer.substr(1); if(buffer.indexOf("\n") <= 0) return; var pos = buffer.lastIndexOf("\n"); var str = buffer.substr(0, pos); var new_sample_arr = str.split("\n"); buffer = buffer.substr(pos + 1); for(var si = 0; si < new_sample_arr.length; si++) { var str = new_sample_arr[si]; var arr = []; if(str.indexOf("\t") > 0) arr = str.split("\t"); else arr = str.split(" "); for(var i = 0; i < arr.length; i++) { var value = parseFloat(arr[i]); if(isNaN(value)) continue; if(i >= data.length) { var new_line = [value]; data.push(new_line); // new line } else data[i].push(value); } sample_count++; } for(var line = 0; line < data.length; line++) { while(data[line].length > MAX_SAMPLE) data[line].splice(0, 1); } if(Y_AXIS_AUTO_SCALE) auto_scale(); } function map(x, in_min, in_max, out_min, out_max) { return (x - in_min) * (out_max - out_min) / (in_max - in_min) + out_min; } function get_random_color() { var letters = '0123456789ABCDEF'; var _color = '#'; for (var i = 0; i < 6; i++) _color += letters[Math.floor(Math.random() * 16)]; return _color; } function update_view() { if(sample_count <= MAX_SAMPLE) X_AXIS_MAX = sample_count; else X_AXIS_MAX = 50; ctx.clearRect(0, 0, WSP_WIDTH, WSP_HEIGHT); ctx.save(); ctx.translate(plot_area_pivot_x, plot_area_pivot_y); ctx.font = "bold 20px Arial"; ctx.textBaseline = "middle"; ctx.textAlign = "center"; ctx.fillStyle = COLOR_TEXT; // draw X axis title if(X_AXIS_TITLE != "") { ctx.fillText(X_AXIS_TITLE, plot_area_width / 2, X_AXIS_VALUE_HEIGHT + X_AXIS_TITLE_HEIGHT / 2); } // draw Y axis title if(Y_AXIS_TITLE != "") { ctx.rotate(-90 * Math.PI / 180); ctx.fillText(Y_AXIS_TITLE, plot_area_height / 2, -Y_AXIS_VALUE_WIDTH - Y_AXIS_TITLE_WIDTH / 2); ctx.rotate(90 * Math.PI / 180); } ctx.font = "16px Arial"; ctx.textAlign = "right"; ctx.strokeStyle = COLOR_BOUND; for(var i = 0; i <= Y_GRIDLINE_NUM; i++) { var y_gridline_px = -map(i, 0, Y_GRIDLINE_NUM, 0, plot_area_height); y_gridline_px = Math.round(y_gridline_px) + 0.5; ctx.beginPath(); ctx.moveTo(0, y_gridline_px); ctx.lineTo(plot_area_width, y_gridline_px); ctx.stroke(); ctx.strokeStyle = COLOR_BOUND; ctx.beginPath(); ctx.moveTo(-7 , y_gridline_px); ctx.lineTo(4, y_gridline_px); ctx.stroke(); var y_gridline_value = map(i, 0, Y_GRIDLINE_NUM, Y_AXIS_MIN, Y_AXIS_MAX); y_gridline_value = y_gridline_value.toFixed(1); ctx.fillText(y_gridline_value + "", -15, y_gridline_px); ctx.strokeStyle = COLOR_GRIDLINE; } ctx.strokeStyle = COLOR_BOUND; ctx.textAlign = "center"; ctx.beginPath(); ctx.moveTo(0.5, y_gridline_px - 7); ctx.lineTo(0.5, y_gridline_px + 4); ctx.stroke(); for(var i = 0; i <= X_GRIDLINE_NUM; i++) { var x_gridline_px = map(i, 0, X_GRIDLINE_NUM, 0, plot_area_width); x_gridline_px = Math.round(x_gridline_px) + 0.5; ctx.beginPath(); ctx.moveTo(x_gridline_px, 0); ctx.lineTo(x_gridline_px, -plot_area_height); ctx.stroke(); ctx.strokeStyle = COLOR_BOUND; ctx.beginPath(); ctx.moveTo(x_gridline_px, 7); ctx.lineTo(x_gridline_px, -4); ctx.stroke(); var x_gridline_value; if(sample_count <= MAX_SAMPLE) x_gridline_value = map(i, 0, X_GRIDLINE_NUM, X_AXIS_MIN, X_AXIS_MAX); else x_gridline_value = map(i, 0, X_GRIDLINE_NUM, sample_count - MAX_SAMPLE, sample_count);; ctx.fillText(x_gridline_value.toString(), x_gridline_px, X_AXIS_VALUE_HEIGHT / 2 + 5); ctx.strokeStyle = COLOR_GRIDLINE; } //ctx.lineWidth = 2; var line_num = data.length; for(var line = 0; line < line_num; line++) { // draw graph var sample_num = data[line].length; if(sample_num >= 2) { var y_value = data[line][0]; var x_px = 0; var y_px = -map(y_value, Y_AXIS_MIN, Y_AXIS_MAX, 0, plot_area_height); if(line == COLOR_LINE.length) COLOR_LINE.push(get_random_color()); ctx.strokeStyle = COLOR_LINE[line]; ctx.beginPath(); ctx.moveTo(x_px, y_px); for(var i = 0; i < sample_num; i++) { y_value = data[line][i]; x_px = map(i, X_AXIS_MIN, X_AXIS_MAX -1, 0, plot_area_width); y_px = -map(y_value, Y_AXIS_MIN, Y_AXIS_MAX, 0, plot_area_height); ctx.lineTo(x_px, y_px); } ctx.stroke(); } // draw legend var x = plot_area_width - (line_num - line) * LEGEND_WIDTH - (line_num - line - 1) * LEGEND_WIDTH / 2; var y = -plot_area_height - PLOT_AREA_PADDING_TOP / 2 - LEGEND_WIDTH / 2; ctx.fillStyle = COLOR_LINE[line]; ctx.beginPath(); ctx.rect(x, y, LEGEND_WIDTH, LEGEND_WIDTH); ctx.fill(); } ctx.restore(); } function canvas_resize() { canvas.width = 0; // to avoid wrong screen size canvas.height = 0; if(WSP_SIZE_TYPE) { // full screen document.getElementById('footer').style.position = "fixed"; var width = window.innerWidth - 20; var height = window.innerHeight - 20; WSP_WIDTH = width; WSP_HEIGHT = height - document.getElementById('header').offsetHeight - document.getElementById('footer').offsetHeight; } canvas.width = WSP_WIDTH; canvas.height = WSP_HEIGHT; ctx.font = "16px Arial"; var y_min_text_size = ctx.measureText(Y_AXIS_MIN.toFixed(1) + "").width; var y_max_text_size = ctx.measureText(Y_AXIS_MAX.toFixed(1) + "").width; Y_AXIS_VALUE_WIDTH = Math.round(Math.max(y_min_text_size, y_max_text_size)) + 15; plot_area_width = WSP_WIDTH - Y_AXIS_VALUE_WIDTH - PLOT_AREA_PADDING_RIGHT; plot_area_height = WSP_HEIGHT - X_AXIS_VALUE_HEIGHT - PLOT_AREA_PADDING_TOP; plot_area_pivot_x = Y_AXIS_VALUE_WIDTH; plot_area_pivot_y = WSP_HEIGHT - X_AXIS_VALUE_HEIGHT; if(X_AXIS_TITLE != "") { plot_area_height -= X_AXIS_TITLE_HEIGHT; plot_area_pivot_y -= X_AXIS_TITLE_HEIGHT; } if(Y_AXIS_TITLE != "") { plot_area_width -= Y_AXIS_TITLE_WIDTH; plot_area_pivot_x += Y_AXIS_TITLE_WIDTH; } ctx.lineWidth = 1; } function auto_scale() { if(data.length >= 1) { var max_arr = []; var min_arr = []; for(var i = 0; i < data.length; i++) { if(data[i].length >= 1) { var max = Math.max.apply(null, data[i]); var min = Math.min.apply(null, data[i]); max_arr.push(max); min_arr.push(min); } } var max = Math.max.apply(null, max_arr); var min = Math.min.apply(null, min_arr); var MIN_DELTA = 10.0; if((max - min) < MIN_DELTA) { var mid = (max + min) / 2; max = mid + MIN_DELTA / 2; min = mid - MIN_DELTA / 2; } var range = max - min; var exp; if (range == 0.0) exp = 0; else exp = Math.floor(Math.log10(range / 4)); var scale = Math.pow(10, exp); var raw_step = (range / 4) / scale; var step; potential_steps =[1.0, 1.5, 2.0, 2.5, 3.0, 4.0, 5.0, 6.0, 8.0, 10.0]; for (var i = 0; i < potential_steps.length; i++) { if (potential_steps[i] < raw_step) continue; step = potential_steps[i] * scale; Y_AXIS_MIN = step * Math.floor(min / step); Y_AXIS_MAX = Y_AXIS_MIN + step * (4); if (Y_AXIS_MAX >= max) break; } var count = 5 - Math.floor((Y_AXIS_MAX - max) / step); Y_AXIS_MAX = Y_AXIS_MIN + step * (count - 1); ctx.font = "16px Arial"; var y_min_text_size = ctx.measureText(Y_AXIS_MIN.toFixed(1) + "").width; var y_max_text_size = ctx.measureText(Y_AXIS_MAX.toFixed(1) + "").width; Y_AXIS_VALUE_WIDTH = Math.round(Math.max(y_min_text_size, y_max_text_size)) + 15; plot_area_width = WSP_WIDTH - Y_AXIS_VALUE_WIDTH - PLOT_AREA_PADDING_RIGHT; plot_area_pivot_x = Y_AXIS_VALUE_WIDTH; } } window.onload = init; </script> </head> <body onresize="canvas_resize()"> <h1 id="header">Arduino - Web Plotter</h1> <canvas id="graph"></canvas> <br> <div id="footer"> <div class="sub-footer"> <h2>WebSocket <span id="ws_state"><span style="color: gray">CLOSED</span></span></h2> </div> <button id="bt_connect" type="button" onclick="connect_onclick();">Connect</button> </div> </body> </html> )=====";
    • Bây giờ bạn có mã ở hai tập tin: ArduinoGetStarted.com.inoindex.h
    • Nhấp vào nút Upload trên Arduino IDE để tải mã lên Arduino.
    • Mở Serial Monitor
    • Xem kết quả trên Serial Monitor.
    COM6
    Send
    Arduino Uno R4 WiFi - WebSocket Server Connected! IP Address: 192.168.0.254 SSID: YOUR_WIFI_SSID IP Address: 192.168.0.254 Signal strength (RSSI): -44 dBm WebSocket server started on port 81 WebSocket URL: ws://192.168.0.254:81 WebSocket server enabled successfully
    Autoscroll Show timestamp
    Clear output
    9600 baud  
    Newline  
    • Ghi chú địa chỉ IP được hiển thị và nhập địa chỉ này vào thanh địa chỉ của trình duyệt web trên điện thoại thông minh hoặc PC của bạn.
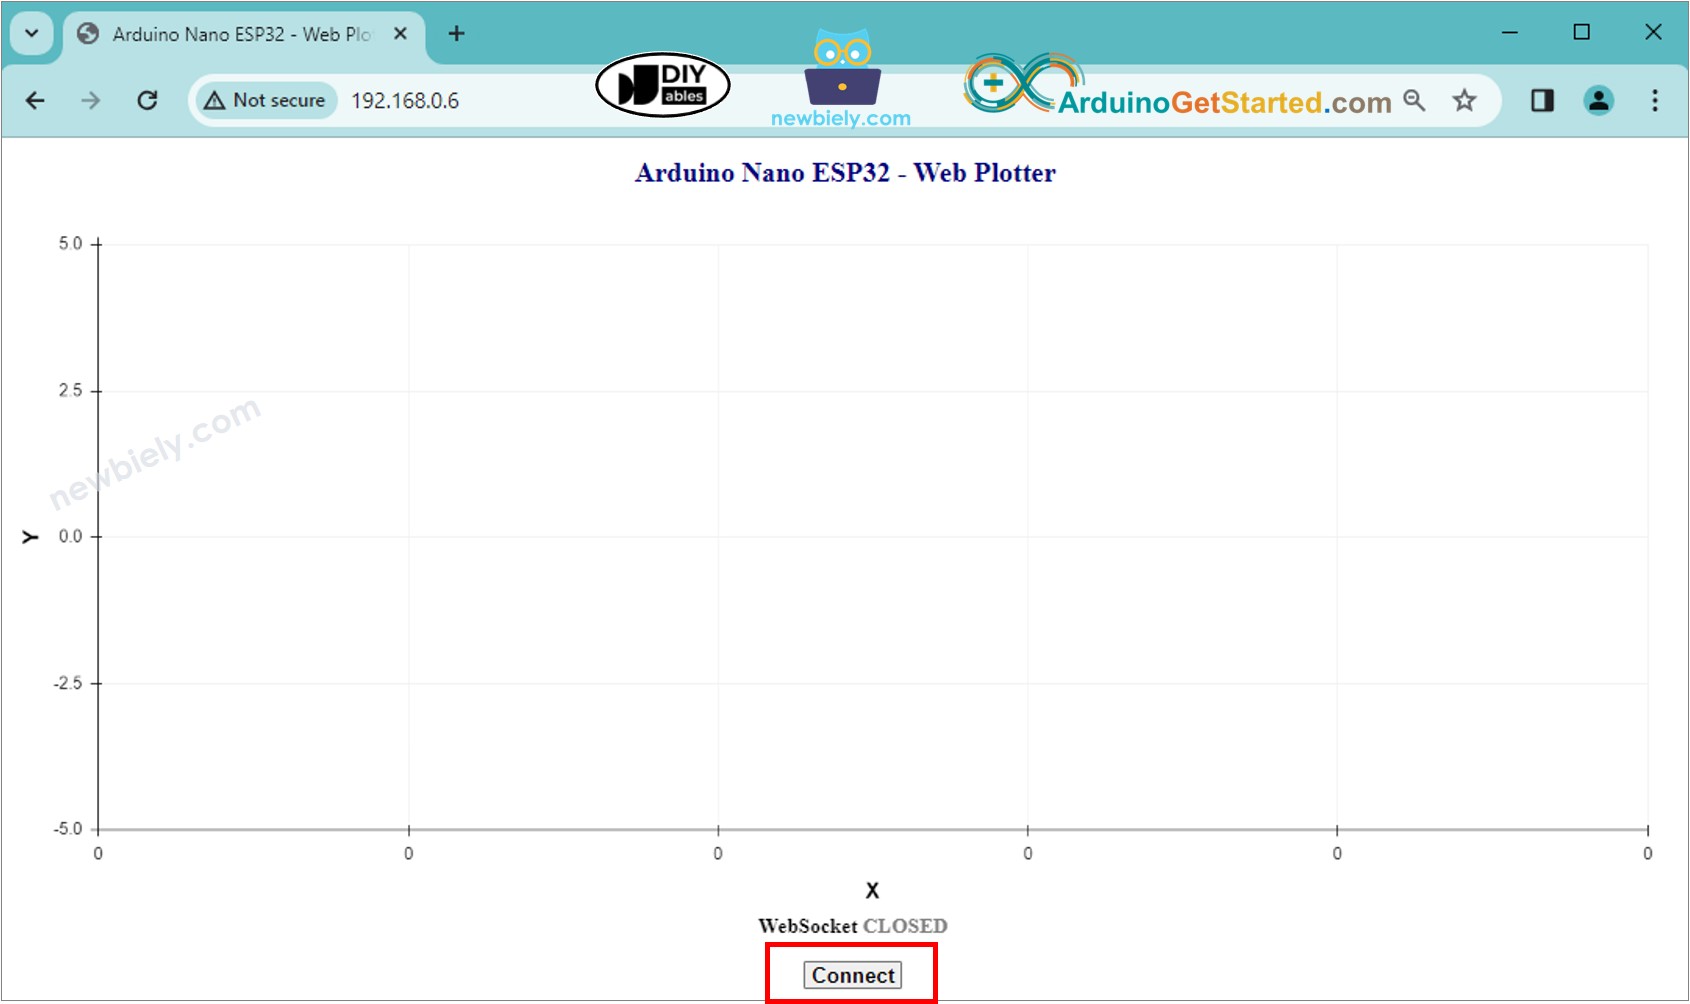
    • Bạn sẽ nhìn thấy trang web như dưới đây:
    trình duyệt web cho máy vẽ Arduino
    • Nhấn nút CONNECT để kết nối trang web với Arduino qua WebSocket.
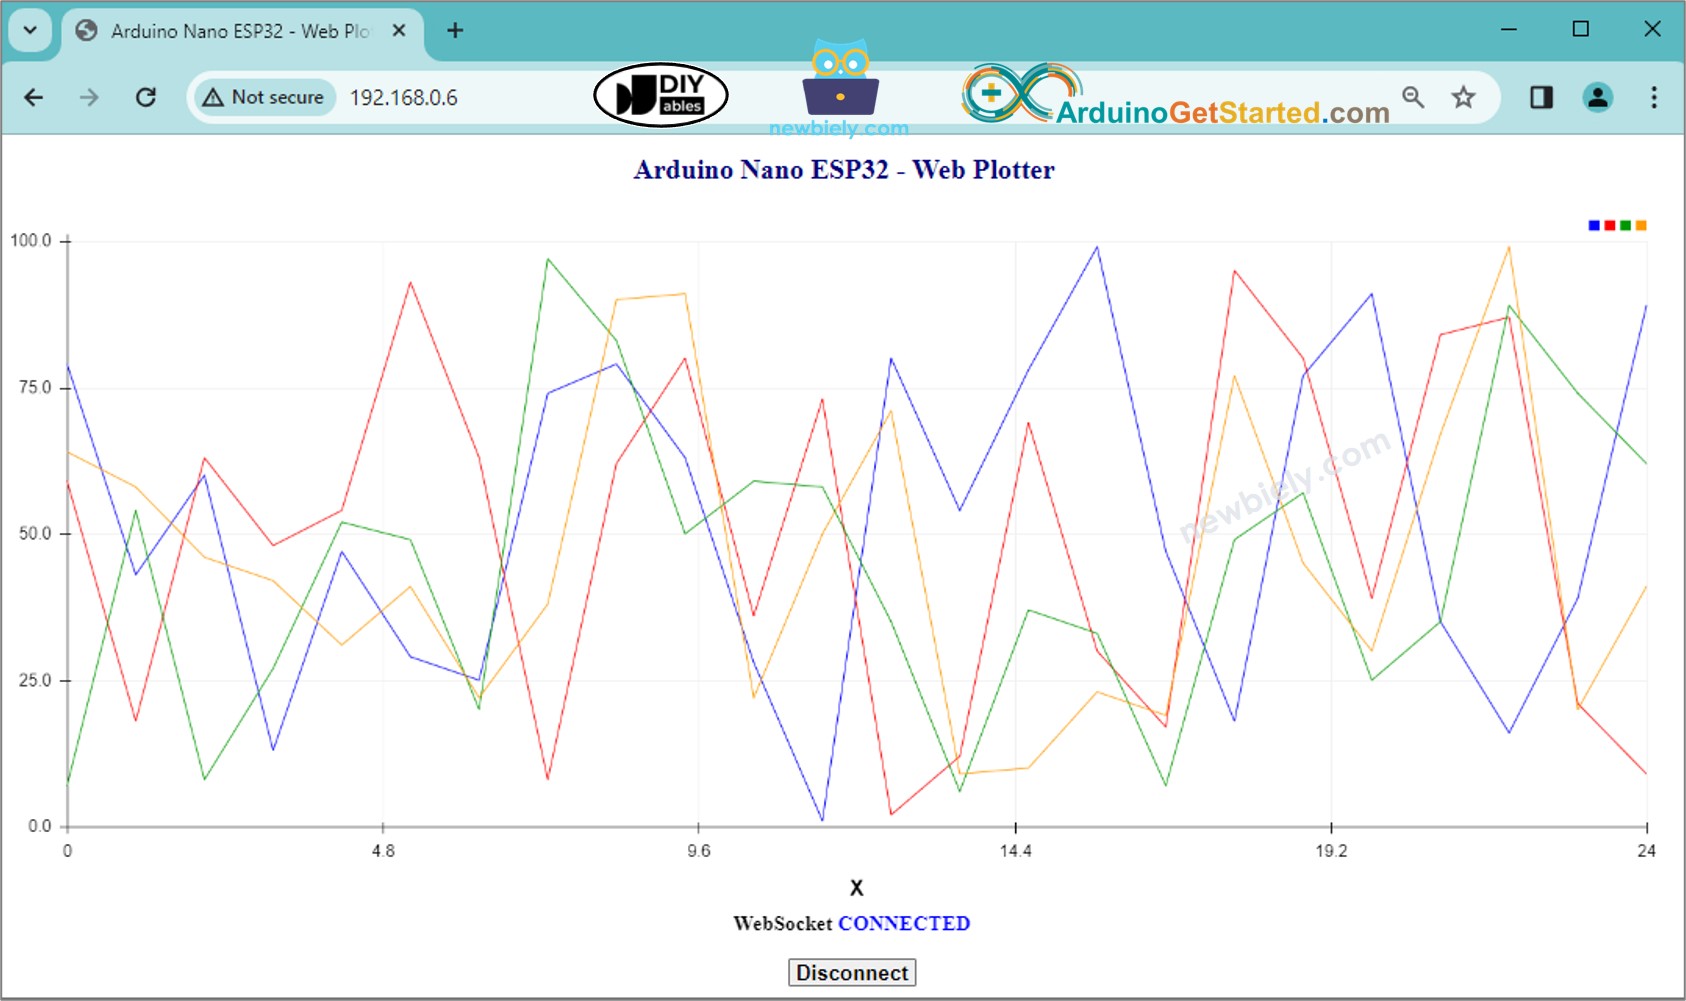
    • Bạn sẽ thấy máy plotter vẽ dữ liệu như hình dưới đây.
    Đồ thị web Arduino
    • Bạn có thể mở Serial Plotter trên Arduino IDE để so sánh với Web Plotter trên trình duyệt web.

    ※ Lưu ý:

    • Nếu bạn chỉnh sửa nội dung HTML trong index.h và không chạm vào bất kỳ phần nào trong tệp ArduinoGetStarted.com.ino, khi bạn biên dịch và tải mã lên Arduino, Arduino IDE sẽ không cập nhật nội dung HTML.
    • Để Arduino IDE cập nhật nội dung HTML trong trường hợp này, hãy thực hiện một thay đổi trong tệp ArduinoGetStarted.com.ino (ví dụ thêm một dòng trống, thêm một bình luận....)

    Giải thích mã theo từng dòng

    Mã Arduino ở trên chứa giải thích theo từng dòng. Vui lòng đọc các chú thích trong mã.