Ví dụ ESP32 WebPlotter Hướng dẫn Trực quan hóa Dữ liệu thời gian thực

Tổng quan

Ví dụ WebPlotter tạo ra một giao diện trực quan hóa dữ liệu thời gian thực có thể truy cập qua bất kỳ trình duyệt web nào. Dành cho nền tảng giáo dục ESP32 với khả năng xử lý dữ liệu được nâng cao, các tính năng vẽ đồ thị thời gian thực và tích hợp liền mạch với các hệ thống giám sát cảm biến. Hoàn hảo để trực quan hóa dữ liệu cảm biến, gỡ lỗi thuật toán, hoặc giám sát hiệu suất hệ thống theo thời gian thực.

ví dụ Arduino webplotter - hướng dẫn trực quan hóa dữ liệu thời gian thực

Các tính năng

  • Vẽ đồ thị dữ liệu thời gian thực: Hiển thị dữ liệu cảm biến khi chúng được truyền từ Arduino
  • Nhiều chuỗi dữ liệu: Vẽ tối đa 8 luồng dữ liệu khác nhau đồng thời
  • Tự động cân chỉnh thang trục Y: Tự động điều chỉnh thang trục Y dựa trên phạm vi dữ liệu
  • Giao diện tương tác: Phóng to, kéo và phân tích xu hướng dữ liệu
  • Giao tiếp WebSocket: Cập nhật tức thì với độ trễ tối thiểu
  • Thiết kế đáp ứng: Hoạt động trên máy tính để bàn, máy tính bảng và thiết bị di động
  • Cấu hình có thể tùy chỉnh: Tiêu đề đồ thị, nhãn trục và phạm vi có thể điều chỉnh

Phần cứng cần chuẩn bị

1×mô-đun phát triển ESP-WROOM-32
1×Alternatively, ESP32 Uno-form board
1×Alternatively, ESP32 S3 Uno-form board
1×USB Cable Type-A to Type-C (for USB-A PC)
1×USB Cable Type-C to Type-C (for USB-C PC)
1×(Khuyến nghị) Screw Terminal Expansion Board for ESP32
1×(Khuyến nghị) Breakout Expansion Board for ESP32
1×(Khuyến nghị) Power Splitter for ESP32

Or you can buy the following kits:

1×DIYables ESP32 Starter Kit (ESP32 included)
1×DIYables Sensor Kit (30 sensors/displays)
1×DIYables Sensor Kit (18 sensors/displays)

Hướng dẫn thiết lập

Các bước nhanh

Hãy thực hiện các hướng dẫn này theo từng bước một:

  • Nếu đây là lần đầu tiên bạn sử dụng ESP32, hãy tham khảo bài hướng dẫn ESP32 - Cài Đặt Phần Mềm.
  • Kết nối bo mạch ESP32 với máy tính của bạn bằng một cáp USB.
  • Khởi động Arduino IDE trên máy tính của bạn.
  • Chọn bo mạch ESP32 phù hợp (ví dụ ESP32 Dev Module) và cổng COM.
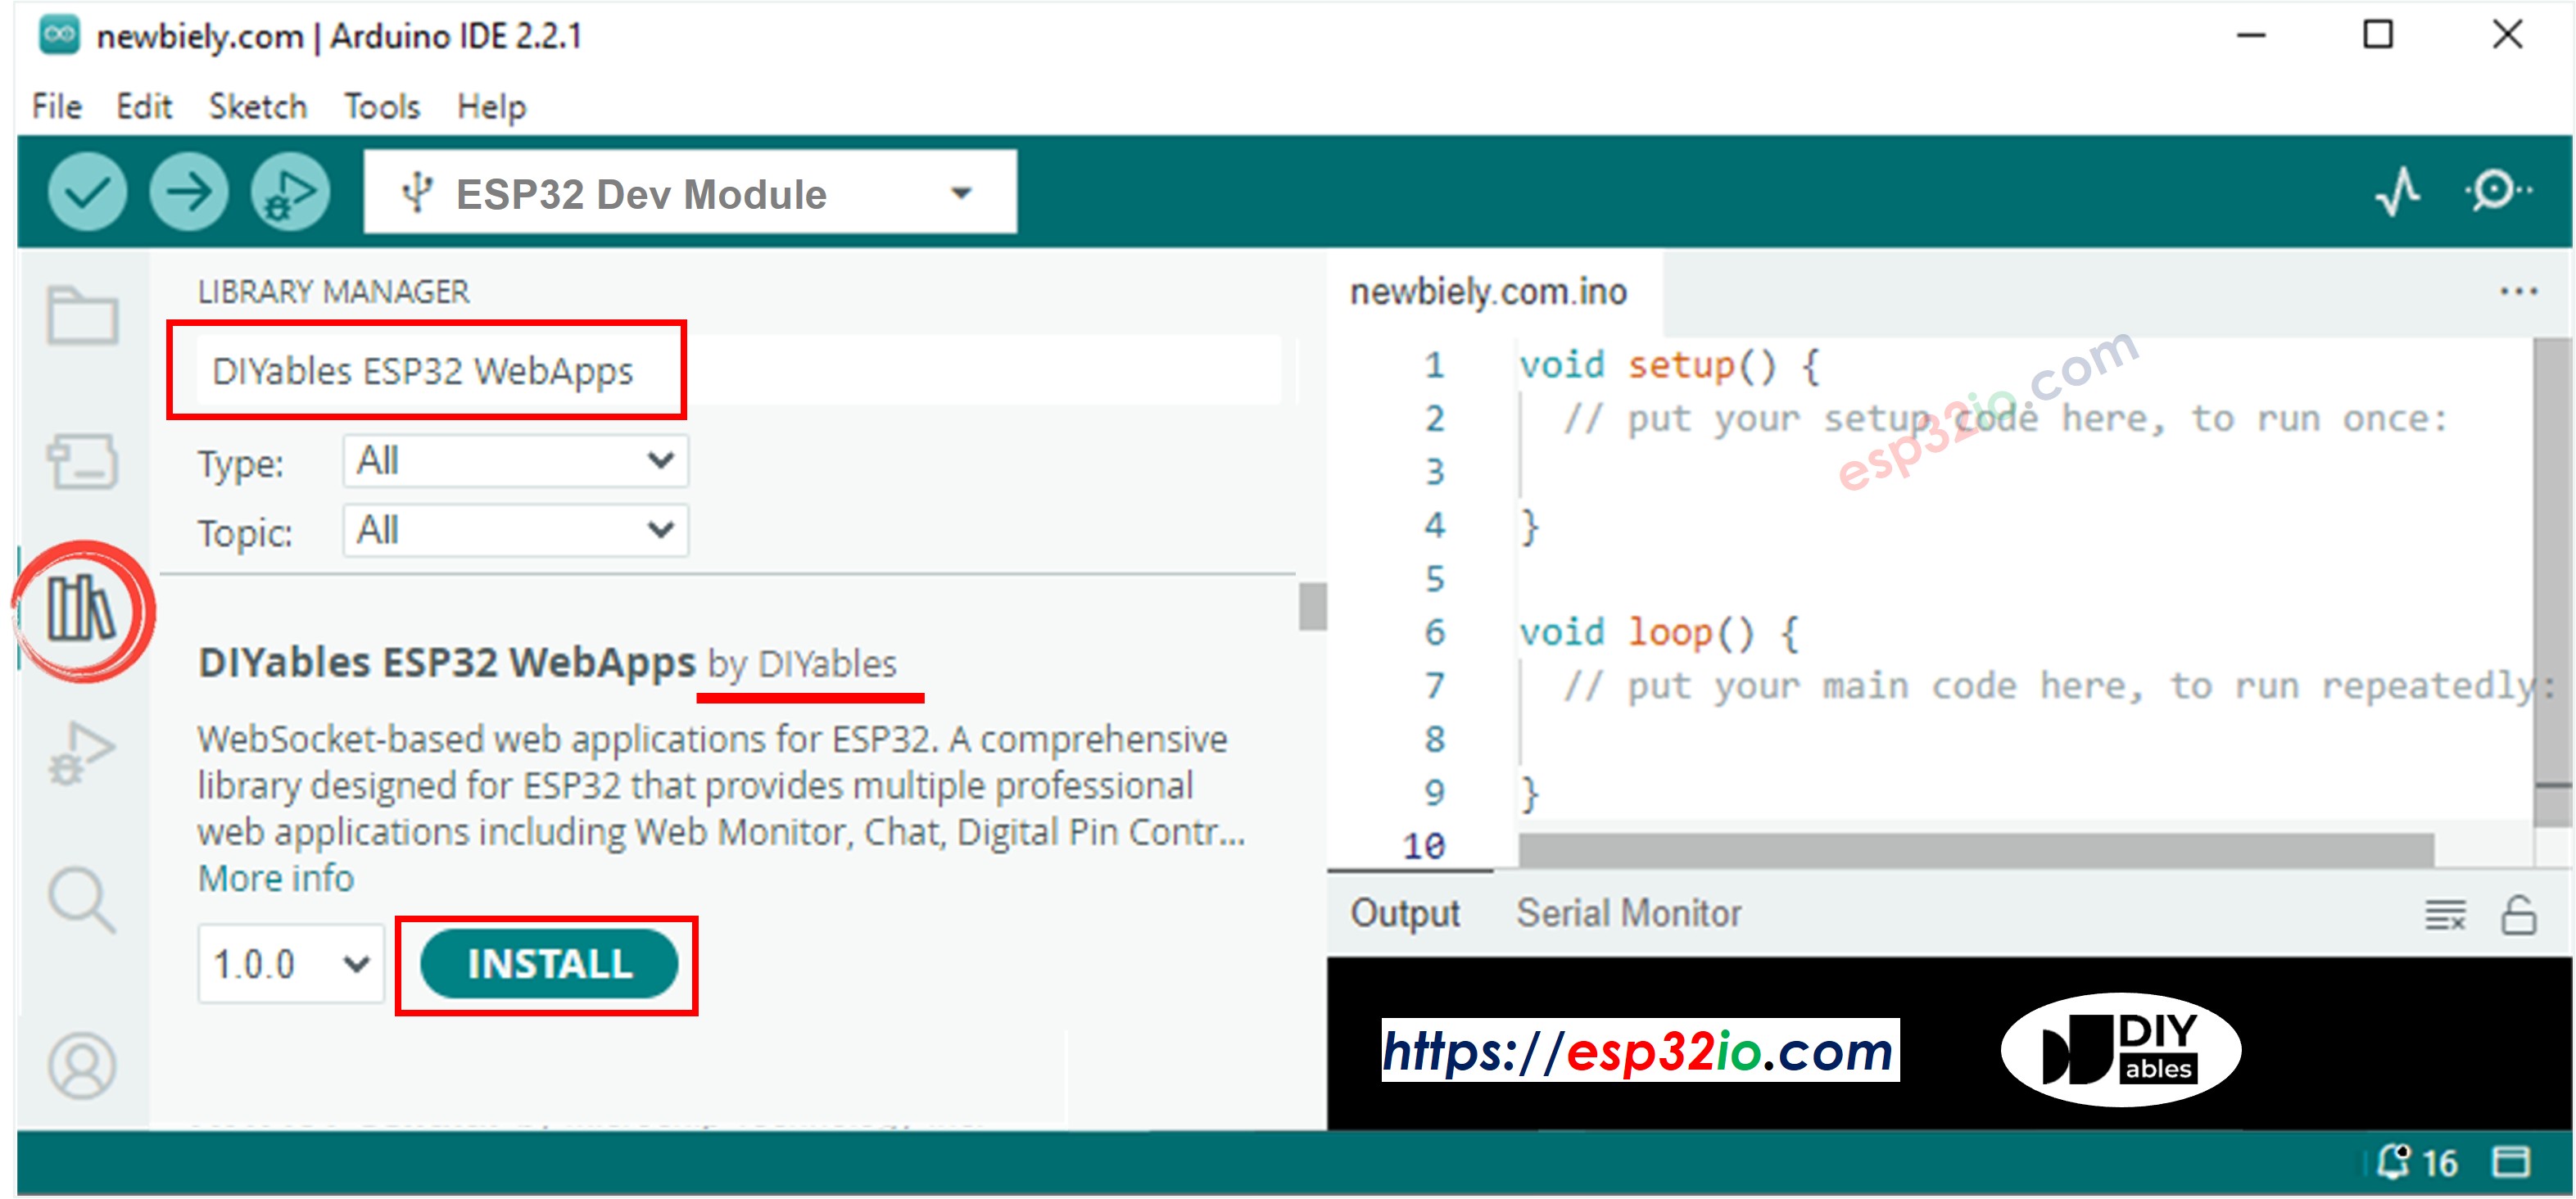
  • Điều hướng đến biểu tượng Libraries ở thanh bên trái của Arduino IDE.
  • Tìm kiếm "DIYables ESP32 WebApps", sau đó tìm thư viện DIYables ESP32 WebApps do DIYables phát hành.
  • Nhấp nút Cài đặt để cài đặt thư viện.
thư viện ESP32 webapps của diyables
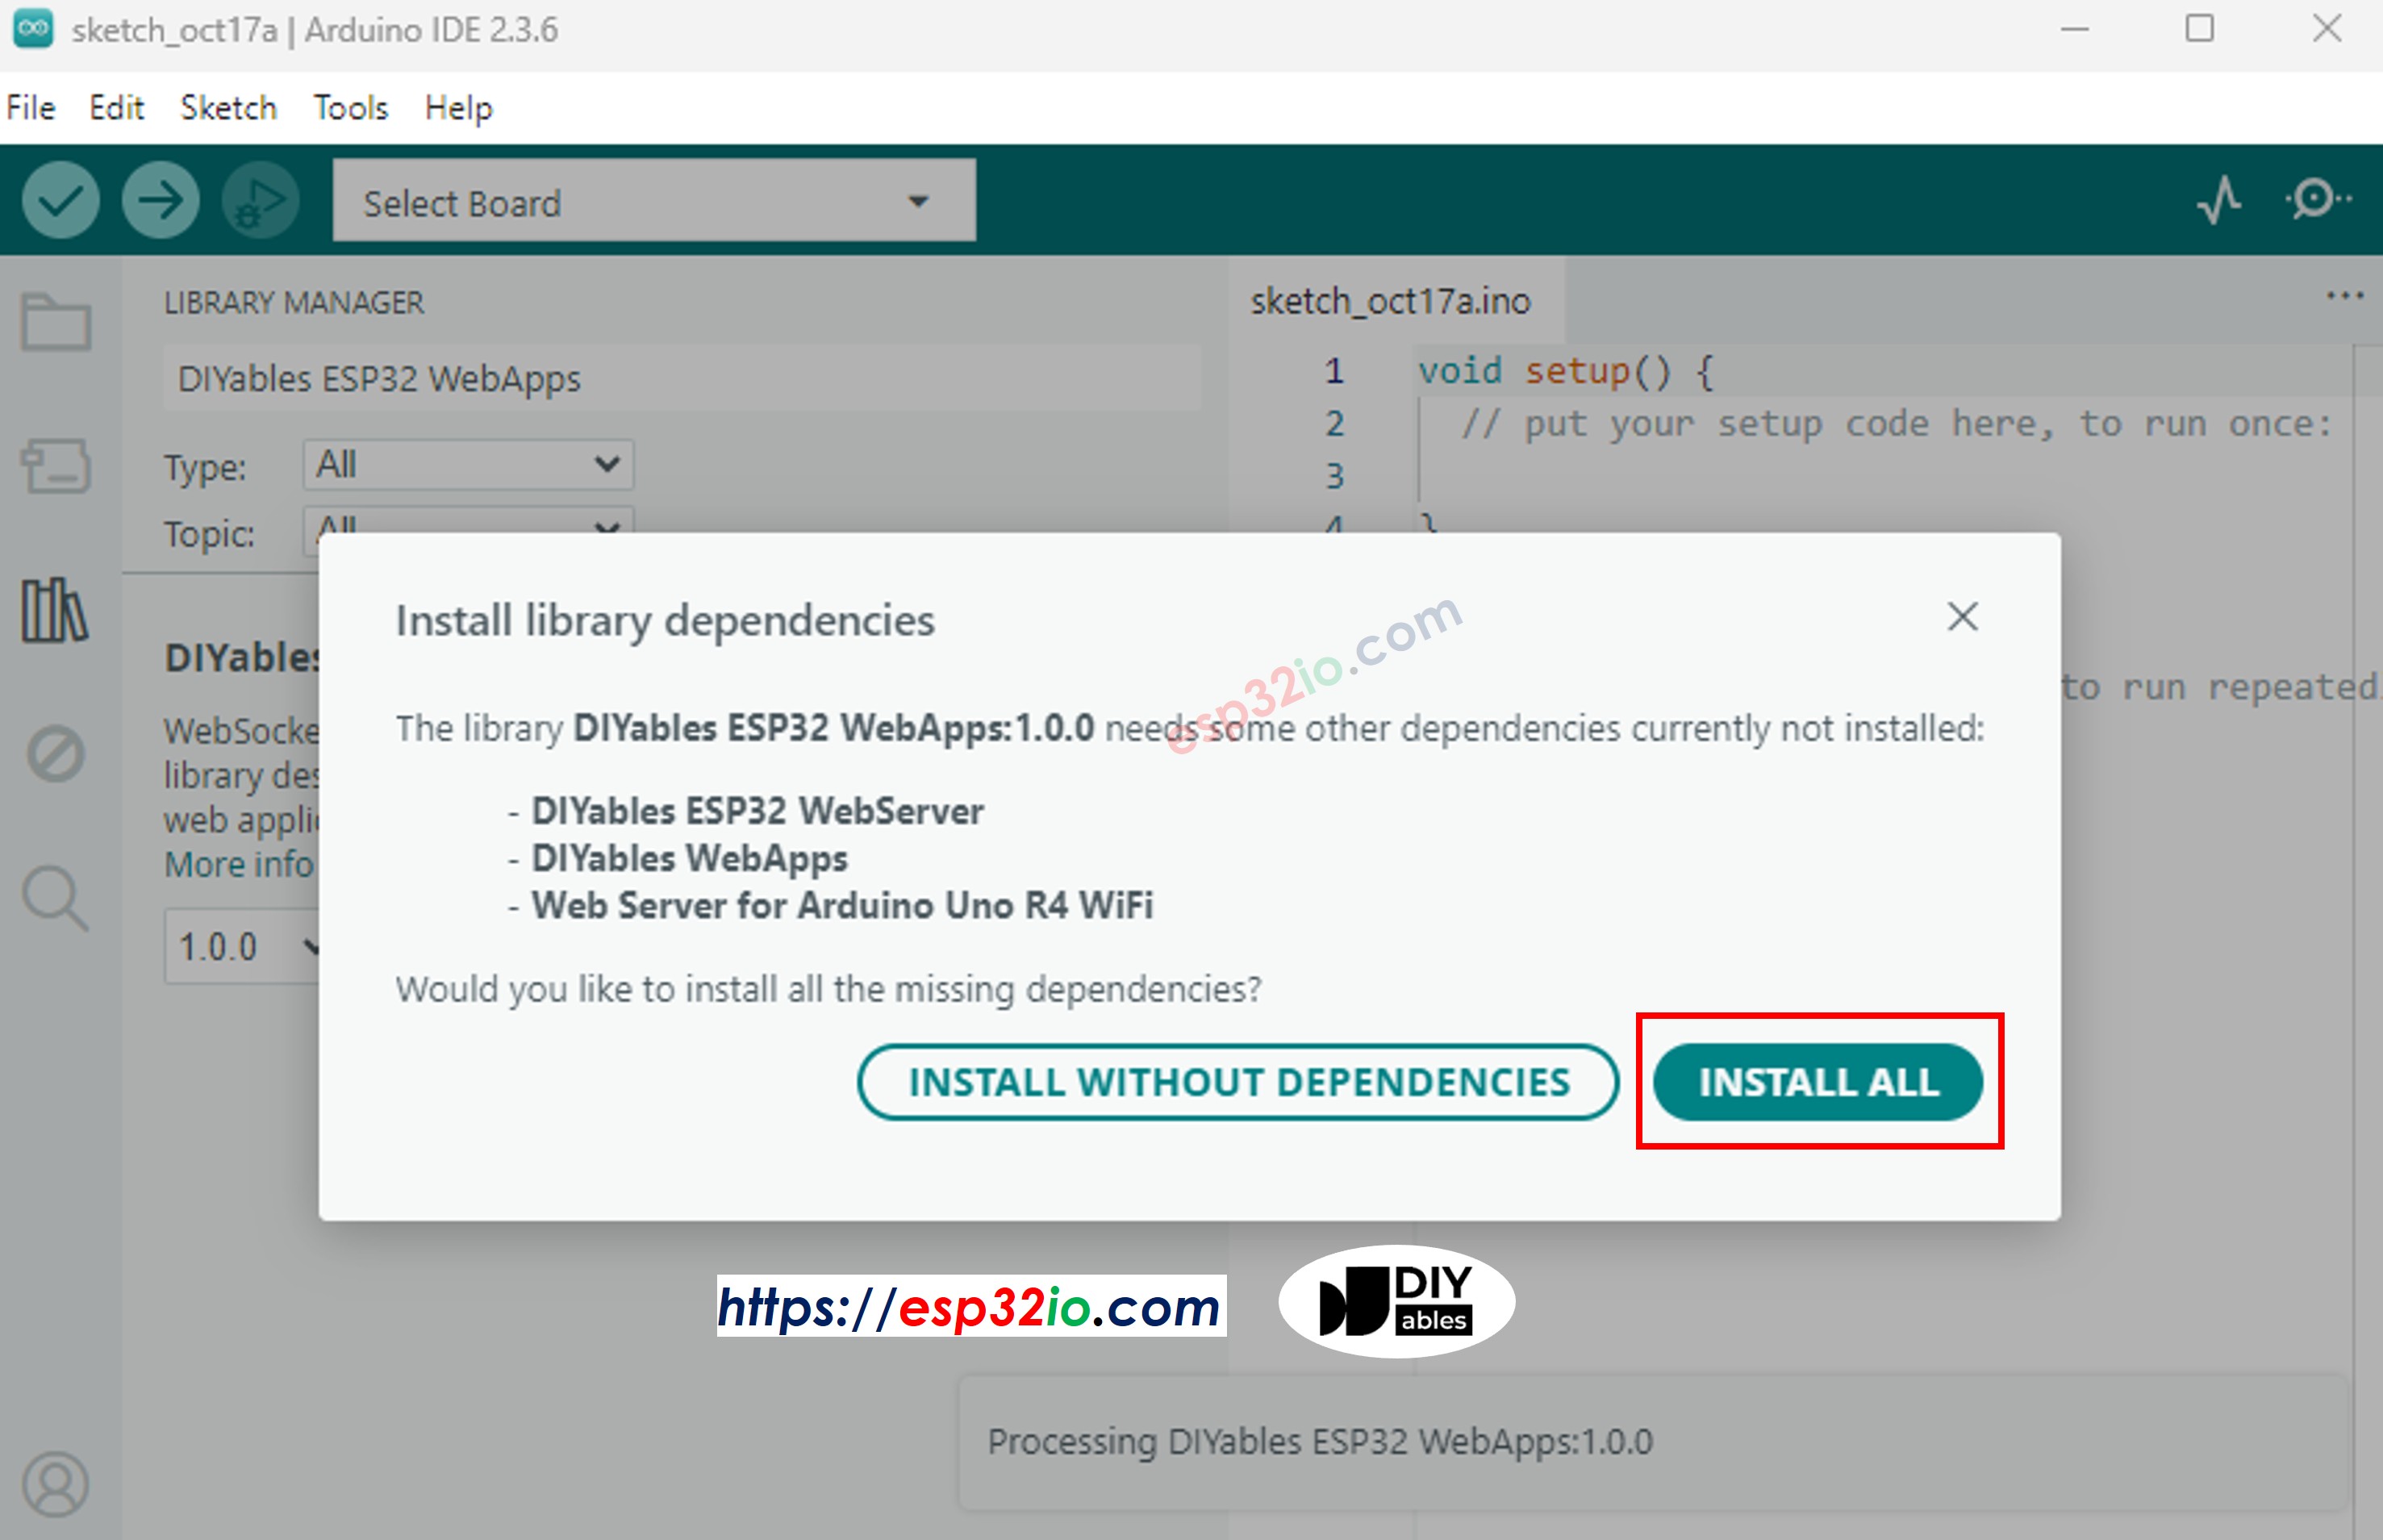
  • Bạn sẽ được yêu cầu cài đặt một số phụ thuộc thư viện khác
  • Nhấp nút Cài đặt Tất cả để cài đặt toàn bộ các phụ thuộc thư viện.
phụ thuộc của diyables ESP32 webapps
  • Trong Arduino IDE, đi tới Tệp tin Ví dụ DIYables ESP32 WebApps WebPlotter ví dụ, hoặc sao chép mã ở trên và dán nó vào trình chỉnh sửa của Arduino IDE
/* * DIYables WebApp Library - Web Plotter Example * * This example demonstrates the Web Plotter feature: * - Real-time data visualization * - Multiple data series support * - Auto-scaling Y-axis * - Responsive web interface * - WebSocket communication for instant updates * * Hardware: ESP32 Boards * * Setup: * 1. Update WiFi credentials below * 2. Upload the sketch to your Arduino * 3. Open Serial Monitor to see the IP address * 4. Navigate to http://[IP_ADDRESS]/webplotter */ #include <DIYables_ESP32_Platform.h> #include <DIYablesWebApps.h> // WiFi credentials - UPDATE THESE WITH YOUR NETWORK const char WIFI_SSID[] = "YOUR_WIFI_SSID"; const char WIFI_PASSWORD[] = "YOUR_WIFI_PASSWORD"; // Create WebApp server and page instances ESP32ServerFactory serverFactory; DIYablesWebAppServer webAppsServer(serverFactory, 80, 81); DIYablesHomePage homePage; DIYablesWebPlotterPage webPlotterPage; // Simulation variables unsigned long lastDataTime = 0; const unsigned long DATA_INTERVAL = 1000; // Send data every 1000ms float timeCounter = 0; void setup() { Serial.begin(9600); delay(1000); // TODO: Initialize your hardware pins and sensors here Serial.println("DIYables ESP32 WebApp - Web Plotter Example"); // Add home and web plotter pages webAppsServer.addApp(&homePage); webAppsServer.addApp(&webPlotterPage); // Optional: Add 404 page for better user experience webAppsServer.setNotFoundPage(DIYablesNotFoundPage()); // Configure the plotter webPlotterPage.setPlotTitle("Real-time Data Plotter"); webPlotterPage.setAxisLabels("Time (s)", "Values"); webPlotterPage.enableAutoScale(true); webPlotterPage.setMaxSamples(50); // Start the WebApp server if (!webAppsServer.begin(WIFI_SSID, WIFI_PASSWORD)) { while (1) { Serial.println("Failed to start WebApp server!"); delay(1000); } } // Set up callbacks webPlotterPage.onPlotterDataRequest([]() { Serial.println("Web client requested data"); sendSensorData(); }); Serial.println("\nWebPlotter is ready!"); Serial.println("Usage Instructions:"); Serial.println("1. Connect to the WiFi network"); Serial.println("2. Open your web browser"); Serial.println("3. Navigate to the Arduino's IP address"); Serial.println("4. Click on 'Web Plotter' to view real-time data"); Serial.println("\nGenerating simulated sensor data..."); } void loop() { // Handle web server and WebSocket connections webAppsServer.loop(); // Send sensor data at regular intervals if (millis() - lastDataTime >= DATA_INTERVAL) { lastDataTime = millis(); sendSensorData(); timeCounter += DATA_INTERVAL / 1000.0; // Convert to seconds } } void sendSensorData() { // Generate simulated sensor data // In a real application, replace these with actual sensor readings // Simulated temperature sensor (sine wave with noise) float temperature = 25.0 + 5.0 * sin(timeCounter * 0.5) + random(-100, 100) / 100.0; // Simulated humidity sensor (cosine wave) float humidity = 50.0 + 20.0 * cos(timeCounter * 0.3); // Simulated light sensor (triangle wave) float light = 512.0 + 300.0 * (2.0 * abs(fmod(timeCounter * 0.2, 2.0) - 1.0) - 1.0); // Simulated analog pin reading float analogValue = analogRead(A0); // Send data using different methods: // Method 1: Send individual values (uncomment to use) // webPlotterPage.sendPlotData(temperature); // Method 2: Send multiple values at once webPlotterPage.sendPlotData(temperature, humidity, light / 10.0, analogValue / 100.0); // Method 3: Send array of values (alternative approach) // float values[] = {temperature, humidity, light / 10.0, analogValue / 100.0}; // webPlotterPage.sendPlotData(values, 4); // Method 4: Send raw data string (for custom formatting) // String dataLine = String(temperature, 2) + " " + String(humidity, 1) + " " + String(light / 10.0, 1); // webPlotterPage.sendPlotData(dataLine); // Print to Serial Monitor in Serial Plotter compatible format // Format: Temperature Humidity Light Analog (tab-separated for Serial Plotter) Serial.print(temperature, 1); Serial.print("\t"); Serial.print(humidity, 1); Serial.print("\t"); Serial.print(light / 10.0, 1); Serial.print("\t"); Serial.println(analogValue / 100.0, 2); }
  • Cấu hình thông tin xác thực WiFi trong mã bằng cách cập nhật các dòng sau:
const char WIFI_SSID[] = "YOUR_WIFI_NETWORK"; const char WIFI_PASSWORD[] = "YOUR_WIFI_PASSWORD";
  • Nhấp vào nút Tải lên trên Arduino IDE để tải mã lên ESP32
  • Mở Serial Monitor
  • Kiểm tra kết quả trên Serial Monitor. Nó trông như hình dưới đây.
COM6
Send
DIYables WebApp - Web Plotter Example INFO: Added app / INFO: Added app /web-plotter DIYables WebApp Library Platform: ESP32 Network connected! IP address: 192.168.0.2 HTTP server started on port 80 Configuring WebSocket server callbacks... WebSocket server started on port 81 WebSocket URL: ws://192.168.0.2:81 WebSocket server started on port 81 ========================================== DIYables WebApp Ready! ========================================== 📱 Web Interface: http://192.168.0.2 🔗 WebSocket: ws://192.168.0.2:81 📋 Available Applications: 🏠 Home Page: http://192.168.0.2/ 📊 Web Plotter: http://192.168.0.2/web-plotter ==========================================
Autoscroll Show timestamp
Clear output
9600 baud  
Newline  
  • Nếu bạn không thấy gì hiển thị, hãy khởi động lại bảng ESP32.
  • Ghi nhớ địa chỉ IP được hiển thị và nhập địa chỉ này vào thanh địa chỉ của trình duyệt trên điện thoại thông minh hoặc máy tính của bạn.
  • Ví dụ: http://192.168.0.2
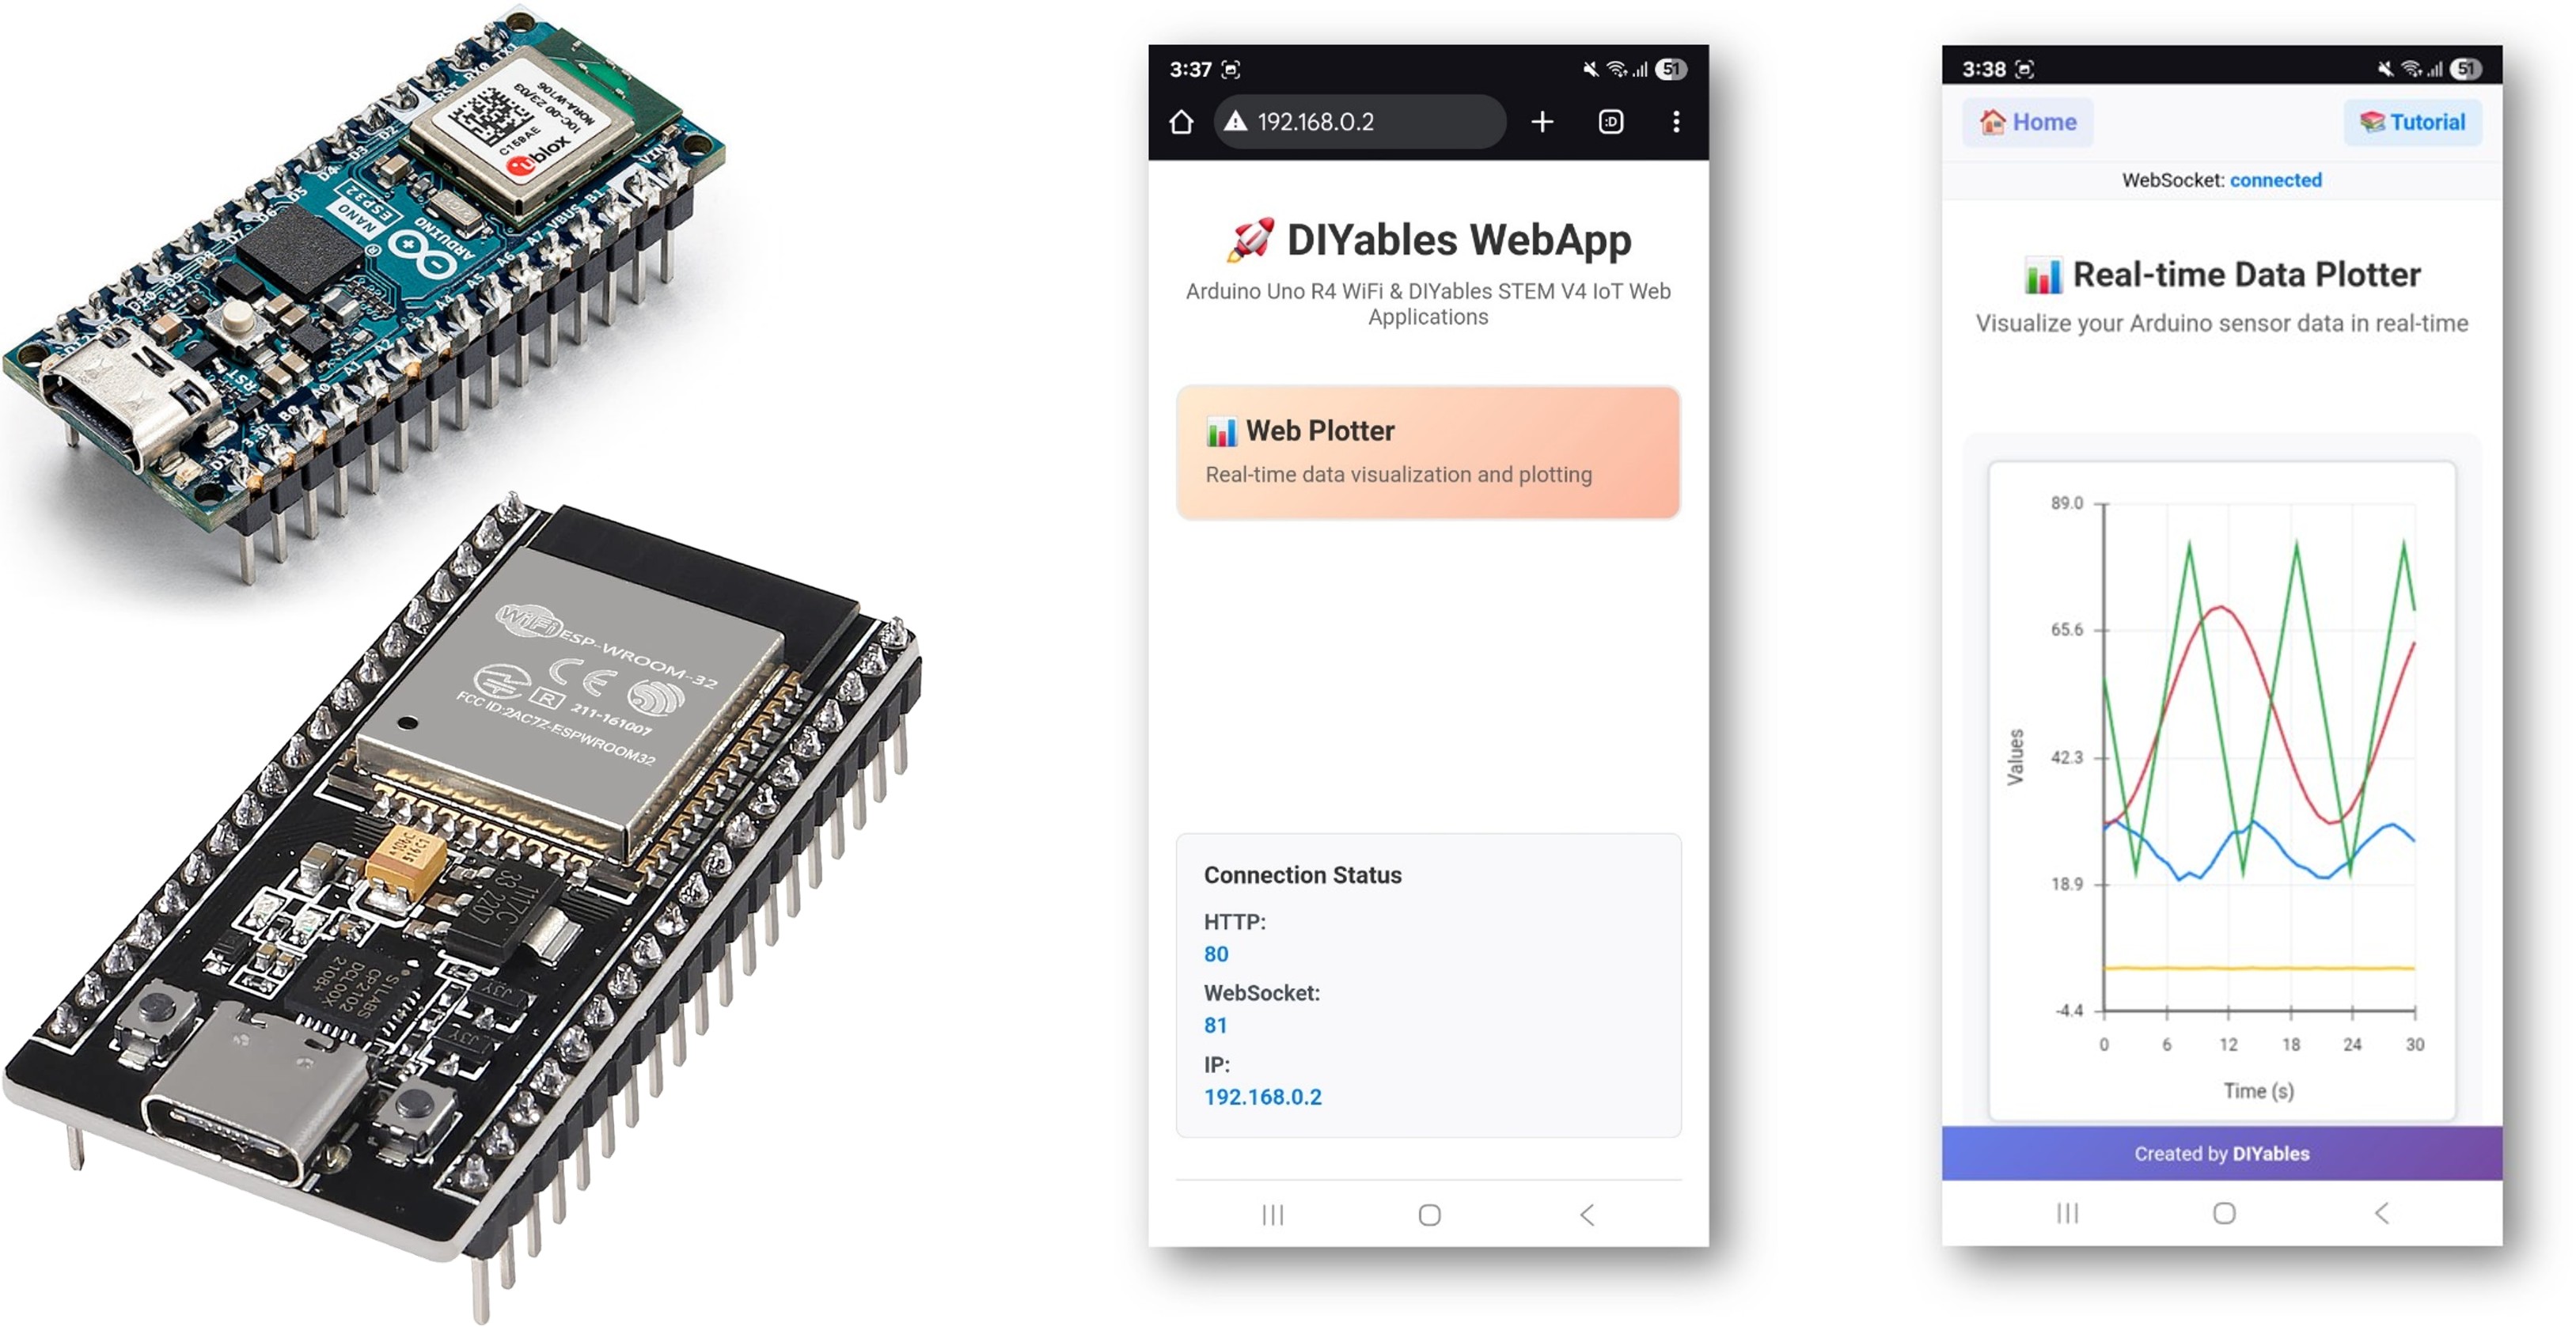
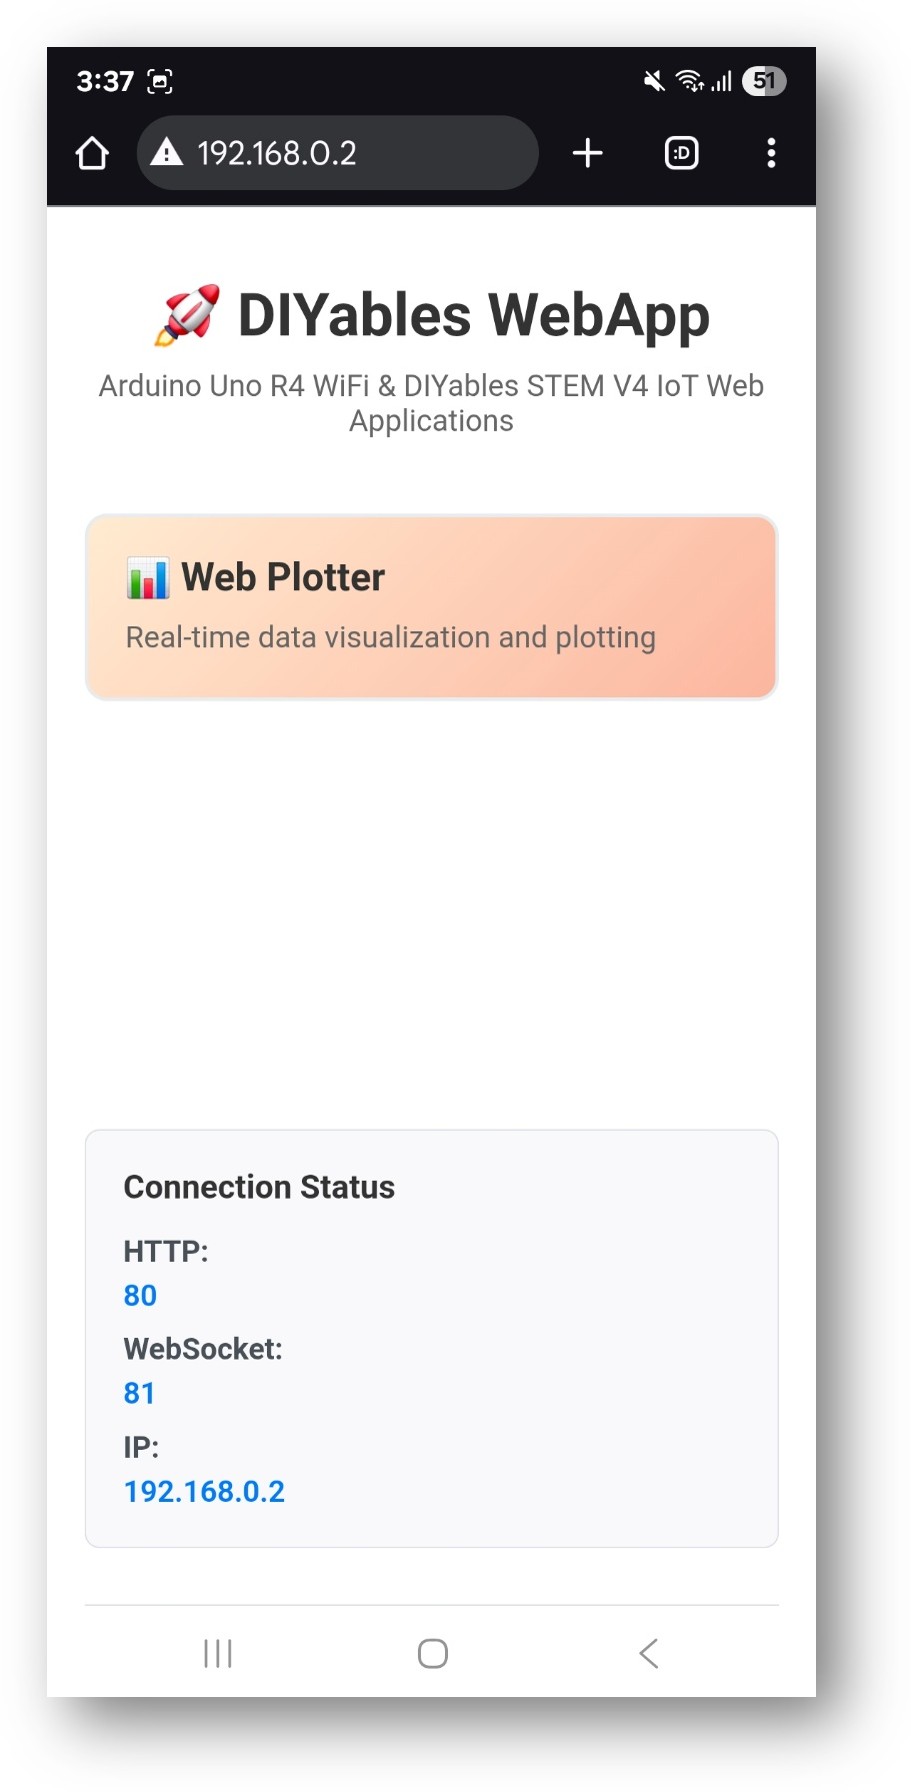
  • Bạn sẽ thấy trang chủ như hình dưới đây:
trang chủ webapp ESP32 diyables với ứng dụng web plotter
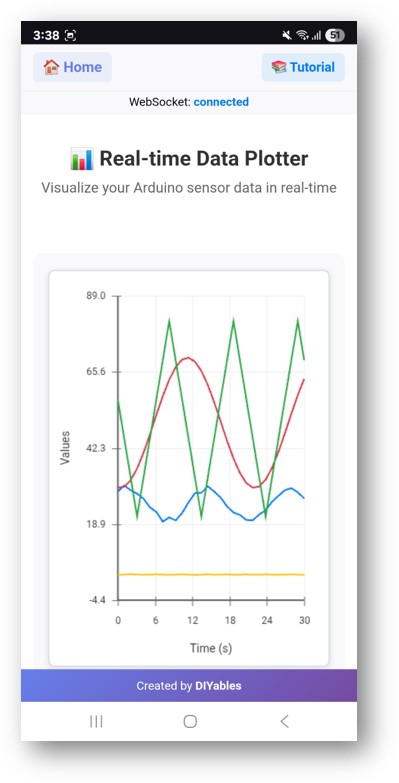
  • Nhấp vào liên kết Web Plotter, bạn sẽ thấy giao diện người dùng của ứng dụng Web Plotter như ở dưới đây:
ESP32 diyables Ứng dụng web plotter
  • Hoặc bạn cũng có thể truy cập trang này trực tiếp bằng địa chỉ IP theo sau là /web-plotter. Ví dụ: http://192.168.0.2/web-plotter
  • Quan sát ESP32 sinh dữ liệu cảm biến giả lập và vẽ chúng theo thời gian thực. Bạn sẽ thấy nhiều đường có màu khác nhau đại diện cho các luồng dữ liệu khác nhau.

Tùy biến sáng tạo - Hiển thị dữ liệu của bạn một cách sáng tạo

Biến đổi giao diện vẽ đồ thị để phù hợp với các yêu cầu dự án độc đáo của bạn và tạo ra các trực quan hóa dữ liệu tuyệt đẹp:

Cấu hình nguồn dữ liệu

Thay thế dữ liệu mô phỏng bằng dữ liệu cảm biến thực:

Phương pháp 1: Đọc cảm biến đơn

void sendTemperatureData() { float temperature = analogRead(A0) * (5.0 / 1023.0) * 100; // LM35 temperature sensor webPlotterPage.sendPlotData(temperature); }

Phương pháp 2: Nhiều cảm biến

void sendMultipleSensors() { float temperature = readTemperature(); float humidity = readHumidity(); float light = analogRead(A1) / 10.0; float pressure = readPressure(); webPlotterPage.sendPlotData(temperature, humidity, light, pressure); }

Phương pháp 3: Mảng các giá trị

void sendSensorArray() { float sensors[6] = { analogRead(A0) / 10.0, // Sensor 1 analogRead(A1) / 10.0, // Sensor 2 analogRead(A2) / 10.0, // Sensor 3 digitalRead(2) * 50, // Digital state millis() / 1000.0, // Time counter random(0, 100) // Random data }; webPlotterPage.sendPlotData(sensors, 6); }

Tùy chỉnh đồ thị

Giao diện đồ thị tùy chỉnh

void setupCustomPlot() { webPlotterPage.setPlotTitle("Environmental Monitoring Station"); webPlotterPage.setAxisLabels("Time (minutes)", "Sensor Readings"); webPlotterPage.setYAxisRange(0, 100); // Fixed Y-axis range webPlotterPage.setMaxSamples(100); // Show more data points }

Cấu hình động

void setupDynamicPlot() { webPlotterPage.setPlotTitle("Smart Garden Monitor"); webPlotterPage.setAxisLabels("Sample #", "Values"); webPlotterPage.enableAutoScale(true); // Auto-adjust Y-axis // Configure callbacks for interactive features webPlotterPage.onPlotterDataRequest([]() { Serial.println("Client connected - sending initial data"); sendInitialDataBurst(); }); }

Xử lý Dữ liệu Nâng cao

Bộ lọc trung bình động

float movingAverage(float newValue) { static float readings[10]; static int index = 0; static float total = 0; total -= readings[index]; readings[index] = newValue; total += readings[index]; index = (index + 1) % 10; return total / 10.0; } void sendFilteredData() { float rawValue = analogRead(A0); float filteredValue = movingAverage(rawValue); webPlotterPage.sendPlotData(rawValue / 10.0, filteredValue / 10.0); }

Ghi nhật ký dữ liệu với dấu thời gian

void sendTimestampedData() { unsigned long currentTime = millis() / 1000; float sensorValue = analogRead(A0) / 10.0; // Send time and value as separate data series webPlotterPage.sendPlotData(currentTime, sensorValue); // Also log to Serial for debugging Serial.print("Time: "); Serial.print(currentTime); Serial.print("s, Value: "); Serial.println(sensorValue); }

Ví dụ tích hợp

Quan trắc môi trường

#include <DHT.h> #define DHT_PIN 2 #define DHT_TYPE DHT22 DHT dht(DHT_PIN, DHT_TYPE); void sendEnvironmentalData() { float temperature = dht.readTemperature(); float humidity = dht.readHumidity(); float lightLevel = analogRead(A0) / 10.0; if (!isnan(temperature) && !isnan(humidity)) { webPlotterPage.sendPlotData(temperature, humidity, lightLevel); Serial.print("T: "); Serial.print(temperature); Serial.print("°C, H: "); Serial.print(humidity); Serial.print("%, Light: "); Serial.println(lightLevel); } }

Phản hồi điều khiển động cơ

void sendMotorData() { int motorSpeed = analogRead(A0); // Speed potentiometer int currentDraw = analogRead(A1); // Current sensor int motorPosition = digitalRead(2); // Position sensor float speedPercent = (motorSpeed / 1023.0) * 100; float currentAmps = (currentDraw / 1023.0) * 5.0; float positionDegrees = motorPosition * 90; webPlotterPage.sendPlotData(speedPercent, currentAmps, positionDegrees); }

Trực quan hóa bộ điều khiển PID

float setpoint = 50.0; float kp = 1.0, ki = 0.1, kd = 0.01; float integral = 0, previousError = 0; void sendPIDData() { float input = analogRead(A0) / 10.0; float error = setpoint - input; integral += error; float derivative = error - previousError; float output = (kp * error) + (ki * integral) + (kd * derivative); previousError = error; // Plot setpoint, input, error, and output webPlotterPage.sendPlotData(setpoint, input, error, output); }

Tối ưu hóa hiệu suất

Truyền tải dữ liệu hiệu quả

unsigned long lastPlotUpdate = 0; const unsigned long PLOT_INTERVAL = 100; // Update every 100ms void efficientDataSending() { if (millis() - lastPlotUpdate >= PLOT_INTERVAL) { lastPlotUpdate = millis(); // Only send data at defined intervals float value1 = analogRead(A0) / 10.0; float value2 = analogRead(A1) / 10.0; webPlotterPage.sendPlotData(value1, value2); } }

Gửi dữ liệu có điều kiện

float lastSentValue = 0; const float CHANGE_THRESHOLD = 5.0; void sendOnChange() { float currentValue = analogRead(A0) / 10.0; // Only send if value changed significantly if (abs(currentValue - lastSentValue) > CHANGE_THRESHOLD) { webPlotterPage.sendPlotData(currentValue); lastSentValue = currentValue; } }

Ý tưởng dự án

Các ứng dụng khoa học

  • Máy ghi dữ liệu: Ghi lại nhiệt độ, độ ẩm, áp suất theo thời gian
  • Phân tích rung động: Giám sát dữ liệu gia tốc kế cho các hệ thống cơ khí
  • Giám sát pH: Theo dõi chất lượng nước trong hệ thống nuôi cá kết hợp thủy canh
  • Hiệu suất tấm pin mặt trời: Giám sát điện áp và dòng điện đầu ra so với ánh sáng mặt trời

Dự án Giáo dục

  • Các thí nghiệm vật lý: Quan sát chuyển động của con lắc và dao động của lò xo
  • Phòng thí nghiệm Hóa học: Theo dõi tốc độ phản ứng và sự thay đổi nhiệt độ
  • Nghiên cứu Sinh học: Theo dõi cảm biến tăng trưởng thực vật và các yếu tố môi trường
  • Toán học: Vẽ đồ thị các hàm số và đầu ra của các thuật toán

Tự động hóa gia đình

  • Giám sát năng lượng: Theo dõi xu hướng tiêu thụ điện năng
  • Tự động hóa vườn: Theo dõi độ ẩm đất và mức độ ánh sáng
  • Điều khiển HVAC: Hiển thị xu hướng nhiệt độ và độ ẩm
  • Hệ thống an ninh: Vẽ đồ thị các hoạt động của cảm biến chuyển động

Robot và Điều khiển

  • Điều hướng robot: Vẽ dữ liệu vị trí và định hướng
  • Điều khiển động cơ: Giám sát tốc độ, mô-men xoắn và hiệu suất
  • Hợp nhất cảm biến: Kết hợp nhiều giá trị cảm biến
  • Lập kế hoạch đường đi: Minh họa các thuật toán di chuyển của robot

Khắc phục sự cố

Các vấn đề phổ biến

  1. Không có dữ liệu hiển thị trên đồ thị
  • Kiểm tra trạng thái kết nối WiFi
  • Xác nhận kết nối WebSocket trong bảng điều khiển trình duyệt
  • Đảm bảo sendPlotData() đang được gọi đều đặn
  • Kiểm tra Trình theo dõi Serial để xem có thông báo lỗi hay không
  1. Đồ thị có vẻ bị rung lắc hoặc thất thường.
  • Thực hiện lọc dữ liệu (trung bình động)
  • Giảm tần suất gửi dữ liệu
  • Kiểm tra nhiễu cảm biến hoặc sự cố kết nối
  • Xác nhận sự ổn định của nguồn cấp điện

3. Các vấn đề về hiệu suất trình duyệt

  • Giảm số lượng mẫu tối đa (setMaxSamples())
  • Giảm tốc độ truyền dữ liệu
  • Đóng các tab trình duyệt khác
  • Kích hoạt tăng tốc phần cứng trong trình duyệt
  1. Mất kết nối WebSocket
  • Kiểm tra cường độ tín hiệu WiFi
  • Xác minh cài đặt của bộ định tuyến (tường lửa, chặn cổng)
  • Triển khai logic tái kết nối trong mã tùy chỉnh
  • Giám sát mức sử dụng bộ nhớ của ESP32

Mẹo gỡ lỗi

Bật Ghi Nhật Ký Chi Tiết

void debugPlotterData() { Serial.println("=== Plotter Debug Info ==="); Serial.print("Free RAM: "); Serial.println(freeMemory()); Serial.print("Connected clients: "); Serial.println(server.getConnectedClients()); Serial.print("Data rate: "); Serial.println("Every " + String(DATA_INTERVAL) + "ms"); Serial.println("========================"); }

Tạo dữ liệu kiểm thử

void generateTestPattern() { static float phase = 0; float sine = sin(phase) * 50 + 50; float cosine = cos(phase) * 30 + 70; float triangle = (phase / PI) * 25 + 25; webPlotterPage.sendPlotData(sine, cosine, triangle); phase += 0.1; if (phase > 2 * PI) phase = 0; }

Các tính năng nâng cao

Định dạng dữ liệu tùy chỉnh

void sendFormattedData() { float temp = 25.5; float humidity = 60.3; // Create custom formatted data string String dataLine = String(temp, 1) + "\t" + String(humidity, 1); webPlotterPage.sendPlotData(dataLine); }

Tích hợp với các ứng dụng web khác

void setupMultipleApps() { // Add multiple web applications server.addApp(new DIYablesHomePage()); server.addApp(new DIYablesWebDigitalPinsPage()); server.addApp(new DIYablesWebSliderPage()); server.addApp(&webPlotterPage); server.addApp(new DIYablesNotFoundPage()); // Configure interactions between apps webSliderPage.onSliderValueFromWeb([](int slider1, int slider2) { // Use slider values to control what gets plotted float scaleFactor = slider1 / 255.0; // ... plotting logic }); }

Điều khiển thời gian thực với đồ thị

void controlAndPlot() { // Read control inputs int targetSpeed = analogRead(A0); // Control hardware analogWrite(9, targetSpeed / 4); // PWM output // Read feedback int actualSpeed = analogRead(A1); int motorCurrent = analogRead(A2); // Plot target vs actual webPlotterPage.sendPlotData( targetSpeed / 4.0, // Target speed actualSpeed / 4.0, // Actual speed motorCurrent / 10.0 // Current draw ); }

Các bước tiếp theo

Sau khi thành thạo ví dụ WebPlotter, hãy khám phá:

  1. MultipleWebApps - Kết hợp đồ thị với giao diện điều khiển
  2. WebMonitor - Thêm khả năng gỡ lỗi bên cạnh việc vẽ đồ thị
  3. Custom Applications - Xây dựng công cụ vẽ đồ thị chuyên dụng cho riêng bạn
  4. Data Analysis - Thực hiện phân tích thống kê cho dữ liệu đã được vẽ

Hỗ trợ

Để được hỗ trợ thêm:

  • Kiểm tra tài liệu tham khảo API
  • Truy cập các bài hướng dẫn DIYables: https://esp32io.com/tutorials/diyables-esp32-webapps
  • Diễn đàn cộng đồng ESP32
  • Công cụ gỡ lỗi WebSocket trong bảng điều khiển dành cho nhà phát triển của trình duyệt