const char *HTML_CONTENT = R"=====(
<!DOCTYPE html>
<html>
<head>
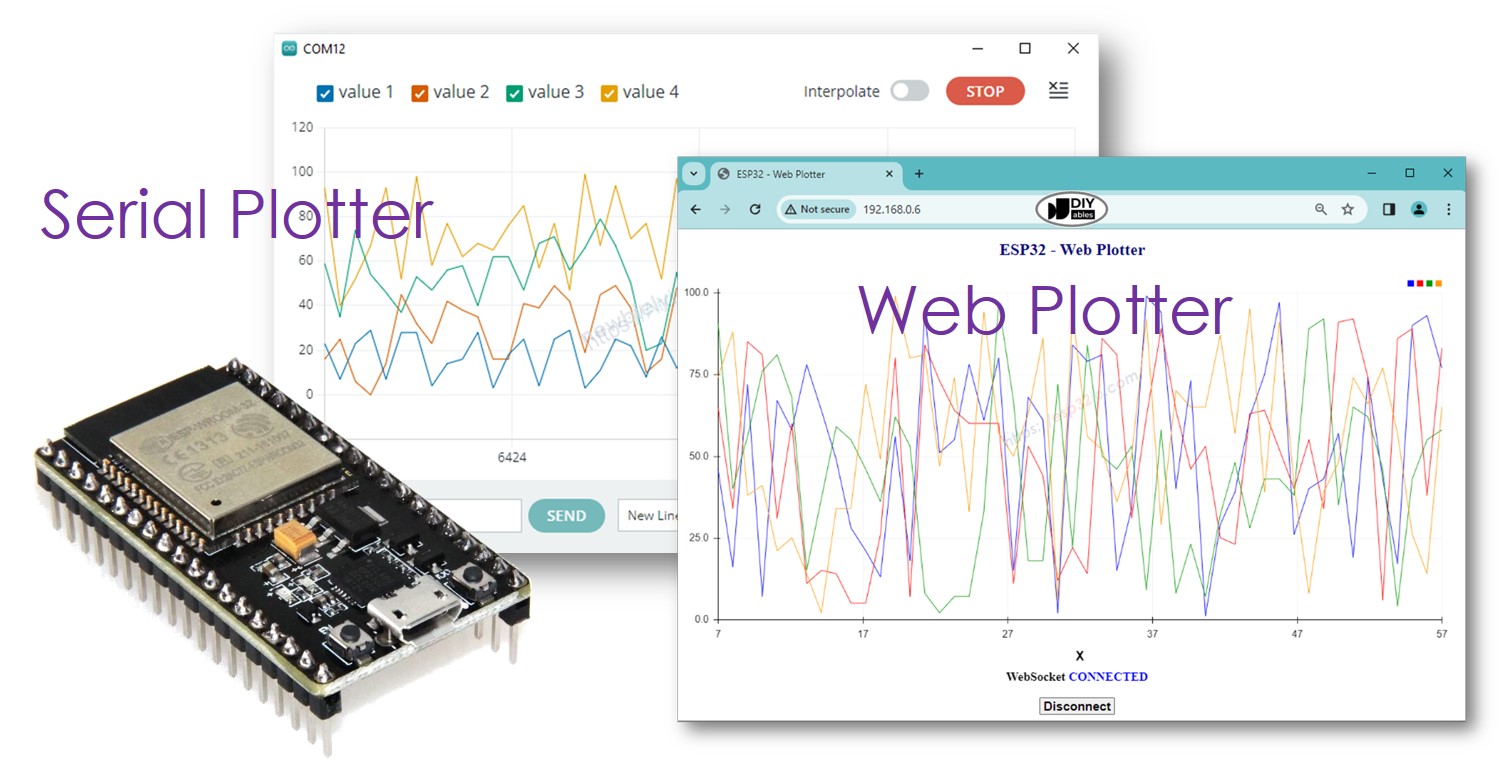
<title>ESP32 - Web Plotter</title>
<meta name="viewport" content="width=device-width, initial-scale=0.7">
<style>
body {text-align: center; height: 750px; }
h1 {font-weight: bold; font-size: 20pt; padding-bottom: 5px; color: navy; }
h2 {font-weight: bold; font-size: 15pt; padding-bottom: 5px; }
button {font-weight: bold; font-size: 15pt; }
#footer {width: 100%; margin: 0px; padding: 0px 0px 10px 0px; bottom: 0px; }
.sub-footer {margin: 0 auto; position: relative; width:400px; }
.sub-footer a {position: absolute; font-size: 10pt; top: 3px; }
</style>
<script>
var COLOR_BACKGROUND = "#FFFFFF";
var COLOR_TEXT = "#000000";
var COLOR_BOUND = "#000000";
var COLOR_GRIDLINE = "#F0F0F0";
var COLOR_LINE = ["#0000FF", "#FF0000", "#009900", "#FF9900", "#CC00CC", "#666666", "#00CCFF", "#000000"];
var LEGEND_WIDTH = 10;
var X_AXIS_TITLE_HEIGHT = 40;
var Y_AXIS_TITLE_WIDTH = 40;
var X_AXIS_VALUE_HEIGHT = 40;
var Y_AXIS_VALUE_WIDTH = 50;
var PLOT_AREA_PADDING_TOP = 30;
var PLOT_AREA_PADDING_RIGHT = 30;
var X_GRIDLINE_NUM = 5;
var Y_GRIDLINE_NUM = 4;
var WSP_SIZE_TYPE = 1;
var WSP_WIDTH = 400;
var WSP_HEIGHT = 200;
var MAX_SAMPLE = 50;
var X_AXIS_MIN = 0;
var X_AXIS_MAX = MAX_SAMPLE;
var Y_AXIS_AUTO_SCALE = 1;
var Y_AXIS_MIN = -5;
var Y_AXIS_MAX = 5;
var X_AXIS_TITLE = "X";
var Y_AXIS_TITLE = "Y";
var plot_area_width;
var plot_area_height;
var plot_area_pivot_x;
var plot_area_pivot_y;
var sample_count = 0;
var buffer = "";
var data = [];
var ws;
var canvas;
var ctx;
function init()
{
canvas = document.getElementById("graph");
canvas.style.backgroundColor = COLOR_BACKGROUND;
ctx = canvas.getContext("2d");
canvas_resize();
setInterval(update_view, 1000 / 60);
}
function connect_onclick()
{
if(ws == null)
{
ws = new WebSocket("ws:
document.getElementById("ws_state").innerHTML = "CONNECTING";
ws.onopen = ws_onopen;
ws.onclose = ws_onclose;
ws.onmessage = ws_onmessage;
ws.binaryType = "arraybuffer";
}
else
ws.close();
}
function ws_onopen()
{
document.getElementById("ws_state").innerHTML = "<span style='color: blue'>CONNECTED</span>";
document.getElementById("bt_connect").innerHTML = "Disconnect";
}
function ws_onclose()
{
document.getElementById("ws_state").innerHTML = "<span style='color: gray'>CLOSED</span>";
document.getElementById("bt_connect").innerHTML = "Connect";
ws.onopen = null;
ws.onclose = null;
ws.onmessage = null;
ws = null;
}
function ws_onmessage(e_msg)
{
e_msg = e_msg || window.event;
console.log(e_msg.data);
buffer += e_msg.data;
buffer = buffer.replace(/\r\n/g, "\n");
buffer = buffer.replace(/\r/g, "\n");
while(buffer.indexOf("\n") == 0)
buffer = buffer.substr(1);
if(buffer.indexOf("\n") <= 0)
return;
var pos = buffer.lastIndexOf("\n");
var str = buffer.substr(0, pos);
var new_sample_arr = str.split("\n");
buffer = buffer.substr(pos + 1);
for(var si = 0; si < new_sample_arr.length; si++)
{
var str = new_sample_arr[si];
var arr = [];
if(str.indexOf("\t") > 0)
arr = str.split("\t");
else
arr = str.split(" ");
for(var i = 0; i < arr.length; i++)
{
var value = parseFloat(arr[i]);
if(isNaN(value))
continue;
if(i >= data.length)
{
var new_line = [value];
data.push(new_line);
}
else
data[i].push(value);
}
sample_count++;
}
for(var line = 0; line < data.length; line++)
{
while(data[line].length > MAX_SAMPLE)
data[line].splice(0, 1);
}
if(Y_AXIS_AUTO_SCALE)
auto_scale();
}
function map(x, in_min, in_max, out_min, out_max)
{
return (x - in_min) * (out_max - out_min) / (in_max - in_min) + out_min;
}
function get_random_color()
{
var letters = '0123456789ABCDEF';
var _color = '#';
for (var i = 0; i < 6; i++)
_color += letters[Math.floor(Math.random() * 16)];
return _color;
}
function update_view()
{
if(sample_count <= MAX_SAMPLE)
X_AXIS_MAX = sample_count;
else
X_AXIS_MAX = 50;
ctx.clearRect(0, 0, WSP_WIDTH, WSP_HEIGHT);
ctx.save();
ctx.translate(plot_area_pivot_x, plot_area_pivot_y);
ctx.font = "bold 20px Arial";
ctx.textBaseline = "middle";
ctx.textAlign = "center";
ctx.fillStyle = COLOR_TEXT;
if(X_AXIS_TITLE != "")
{
ctx.fillText(X_AXIS_TITLE, plot_area_width / 2, X_AXIS_VALUE_HEIGHT + X_AXIS_TITLE_HEIGHT / 2);
}
if(Y_AXIS_TITLE != "")
{
ctx.rotate(-90 * Math.PI / 180);
ctx.fillText(Y_AXIS_TITLE, plot_area_height / 2, -Y_AXIS_VALUE_WIDTH - Y_AXIS_TITLE_WIDTH / 2);
ctx.rotate(90 * Math.PI / 180);
}
ctx.font = "16px Arial";
ctx.textAlign = "right";
ctx.strokeStyle = COLOR_BOUND;
for(var i = 0; i <= Y_GRIDLINE_NUM; i++)
{
var y_gridline_px = -map(i, 0, Y_GRIDLINE_NUM, 0, plot_area_height);
y_gridline_px = Math.round(y_gridline_px) + 0.5;
ctx.beginPath();
ctx.moveTo(0, y_gridline_px);
ctx.lineTo(plot_area_width, y_gridline_px);
ctx.stroke();
ctx.strokeStyle = COLOR_BOUND;
ctx.beginPath();
ctx.moveTo(-7 , y_gridline_px);
ctx.lineTo(4, y_gridline_px);
ctx.stroke();
var y_gridline_value = map(i, 0, Y_GRIDLINE_NUM, Y_AXIS_MIN, Y_AXIS_MAX);
y_gridline_value = y_gridline_value.toFixed(1);
ctx.fillText(y_gridline_value + "", -15, y_gridline_px);
ctx.strokeStyle = COLOR_GRIDLINE;
}
ctx.strokeStyle = COLOR_BOUND;
ctx.textAlign = "center";
ctx.beginPath();
ctx.moveTo(0.5, y_gridline_px - 7);
ctx.lineTo(0.5, y_gridline_px + 4);
ctx.stroke();
for(var i = 0; i <= X_GRIDLINE_NUM; i++)
{
var x_gridline_px = map(i, 0, X_GRIDLINE_NUM, 0, plot_area_width);
x_gridline_px = Math.round(x_gridline_px) + 0.5;
ctx.beginPath();
ctx.moveTo(x_gridline_px, 0);
ctx.lineTo(x_gridline_px, -plot_area_height);
ctx.stroke();
ctx.strokeStyle = COLOR_BOUND;
ctx.beginPath();
ctx.moveTo(x_gridline_px, 7);
ctx.lineTo(x_gridline_px, -4);
ctx.stroke();
var x_gridline_value;
if(sample_count <= MAX_SAMPLE)
x_gridline_value = map(i, 0, X_GRIDLINE_NUM, X_AXIS_MIN, X_AXIS_MAX);
else
x_gridline_value = map(i, 0, X_GRIDLINE_NUM, sample_count - MAX_SAMPLE, sample_count);;
ctx.fillText(x_gridline_value.toString(), x_gridline_px, X_AXIS_VALUE_HEIGHT / 2 + 5);
ctx.strokeStyle = COLOR_GRIDLINE;
}
var line_num = data.length;
for(var line = 0; line < line_num; line++)
{
var sample_num = data[line].length;
if(sample_num >= 2)
{
var y_value = data[line][0];
var x_px = 0;
var y_px = -map(y_value, Y_AXIS_MIN, Y_AXIS_MAX, 0, plot_area_height);
if(line == COLOR_LINE.length)
COLOR_LINE.push(get_random_color());
ctx.strokeStyle = COLOR_LINE[line];
ctx.beginPath();
ctx.moveTo(x_px, y_px);
for(var i = 0; i < sample_num; i++)
{
y_value = data[line][i];
x_px = map(i, X_AXIS_MIN, X_AXIS_MAX -1, 0, plot_area_width);
y_px = -map(y_value, Y_AXIS_MIN, Y_AXIS_MAX, 0, plot_area_height);
ctx.lineTo(x_px, y_px);
}
ctx.stroke();
}
var x = plot_area_width - (line_num - line) * LEGEND_WIDTH - (line_num - line - 1) * LEGEND_WIDTH / 2;
var y = -plot_area_height - PLOT_AREA_PADDING_TOP / 2 - LEGEND_WIDTH / 2;
ctx.fillStyle = COLOR_LINE[line];
ctx.beginPath();
ctx.rect(x, y, LEGEND_WIDTH, LEGEND_WIDTH);
ctx.fill();
}
ctx.restore();
}
function canvas_resize()
{
canvas.width = 0;
canvas.height = 0;
if(WSP_SIZE_TYPE)
{
document.getElementById('footer').style.position = "fixed";
var width = window.innerWidth - 20;
var height = window.innerHeight - 20;
WSP_WIDTH = width;
WSP_HEIGHT = height - document.getElementById('header').offsetHeight - document.getElementById('footer').offsetHeight;
}
canvas.width = WSP_WIDTH;
canvas.height = WSP_HEIGHT;
ctx.font = "16px Arial";
var y_min_text_size = ctx.measureText(Y_AXIS_MIN.toFixed(1) + "").width;
var y_max_text_size = ctx.measureText(Y_AXIS_MAX.toFixed(1) + "").width;
Y_AXIS_VALUE_WIDTH = Math.round(Math.max(y_min_text_size, y_max_text_size)) + 15;
plot_area_width = WSP_WIDTH - Y_AXIS_VALUE_WIDTH - PLOT_AREA_PADDING_RIGHT;
plot_area_height = WSP_HEIGHT - X_AXIS_VALUE_HEIGHT - PLOT_AREA_PADDING_TOP;
plot_area_pivot_x = Y_AXIS_VALUE_WIDTH;
plot_area_pivot_y = WSP_HEIGHT - X_AXIS_VALUE_HEIGHT;
if(X_AXIS_TITLE != "")
{
plot_area_height -= X_AXIS_TITLE_HEIGHT;
plot_area_pivot_y -= X_AXIS_TITLE_HEIGHT;
}
if(Y_AXIS_TITLE != "")
{
plot_area_width -= Y_AXIS_TITLE_WIDTH;
plot_area_pivot_x += Y_AXIS_TITLE_WIDTH;
}
ctx.lineWidth = 1;
}
function auto_scale()
{
if(data.length >= 1)
{
var max_arr = [];
var min_arr = [];
for(var i = 0; i < data.length; i++)
{
if(data[i].length >= 1)
{
var max = Math.max.apply(null, data[i]);
var min = Math.min.apply(null, data[i]);
max_arr.push(max);
min_arr.push(min);
}
}
var max = Math.max.apply(null, max_arr);
var min = Math.min.apply(null, min_arr);
var MIN_DELTA = 10.0;
if((max - min) < MIN_DELTA)
{
var mid = (max + min) / 2;
max = mid + MIN_DELTA / 2;
min = mid - MIN_DELTA / 2;
}
var range = max - min;
var exp;
if (range == 0.0)
exp = 0;
else
exp = Math.floor(Math.log10(range / 4));
var scale = Math.pow(10, exp);
var raw_step = (range / 4) / scale;
var step;
potential_steps =[1.0, 1.5, 2.0, 2.5, 3.0, 4.0, 5.0, 6.0, 8.0, 10.0];
for (var i = 0; i < potential_steps.length; i++)
{
if (potential_steps[i] < raw_step)
continue;
step = potential_steps[i] * scale;
Y_AXIS_MIN = step * Math.floor(min / step);
Y_AXIS_MAX = Y_AXIS_MIN + step * (4);
if (Y_AXIS_MAX >= max)
break;
}
var count = 5 - Math.floor((Y_AXIS_MAX - max) / step);
Y_AXIS_MAX = Y_AXIS_MIN + step * (count - 1);
ctx.font = "16px Arial";
var y_min_text_size = ctx.measureText(Y_AXIS_MIN.toFixed(1) + "").width;
var y_max_text_size = ctx.measureText(Y_AXIS_MAX.toFixed(1) + "").width;
Y_AXIS_VALUE_WIDTH = Math.round(Math.max(y_min_text_size, y_max_text_size)) + 15;
plot_area_width = WSP_WIDTH - Y_AXIS_VALUE_WIDTH - PLOT_AREA_PADDING_RIGHT;
plot_area_pivot_x = Y_AXIS_VALUE_WIDTH;
}
}
window.onload = init;
</script>
</head>
<body onresize="canvas_resize()">
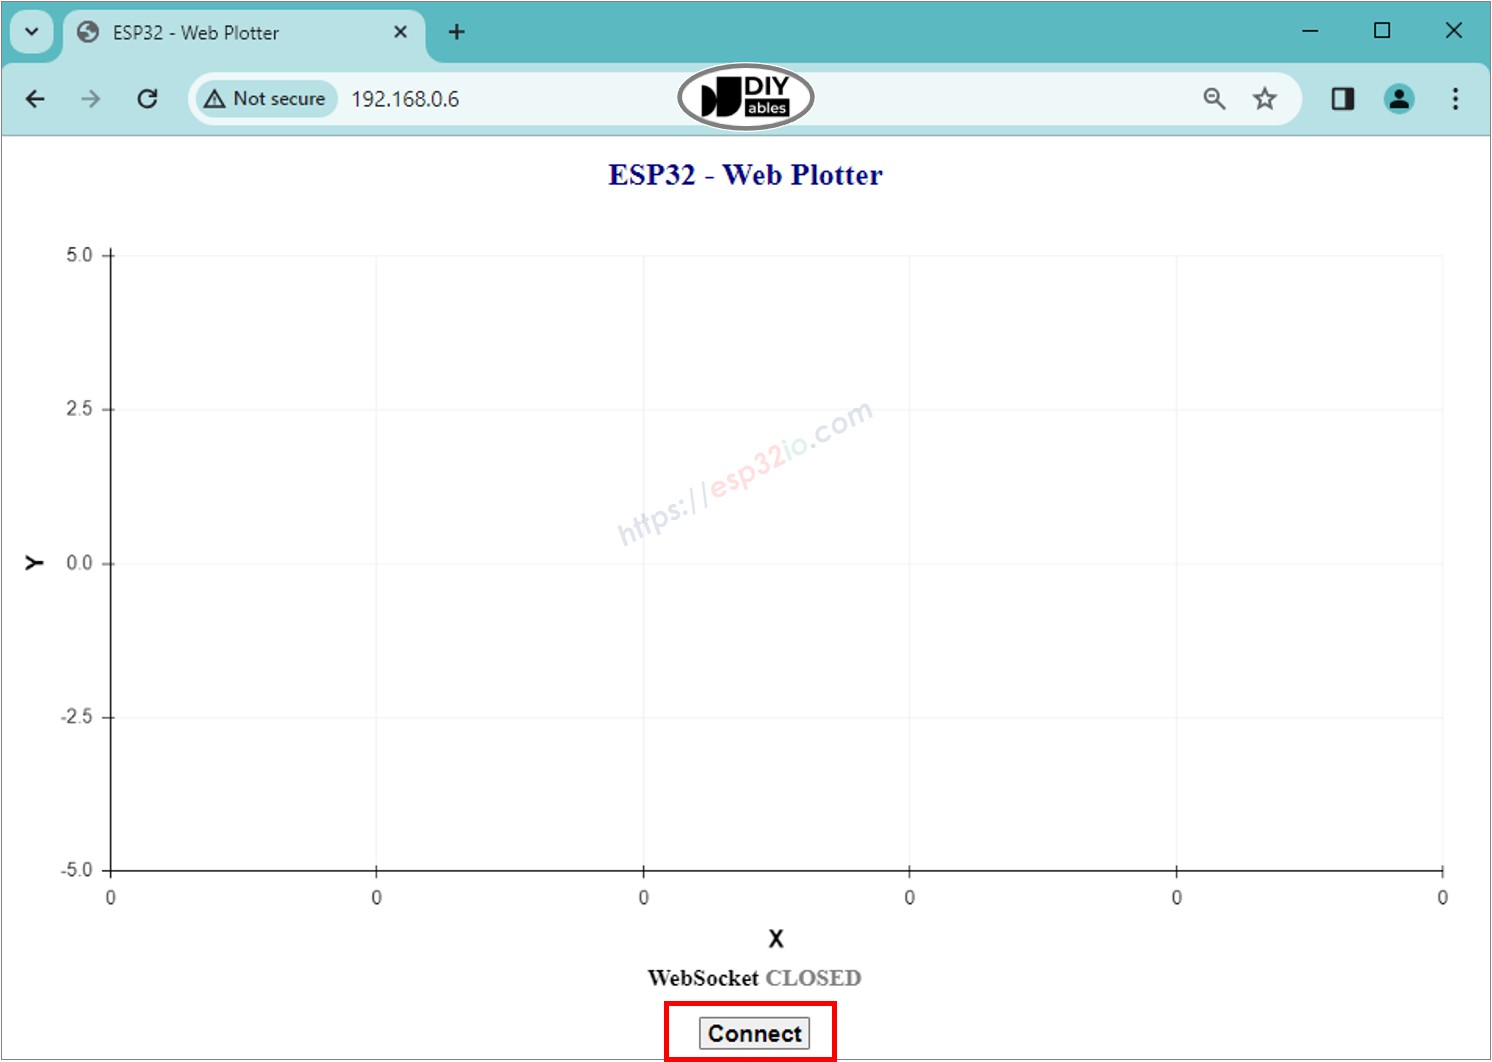
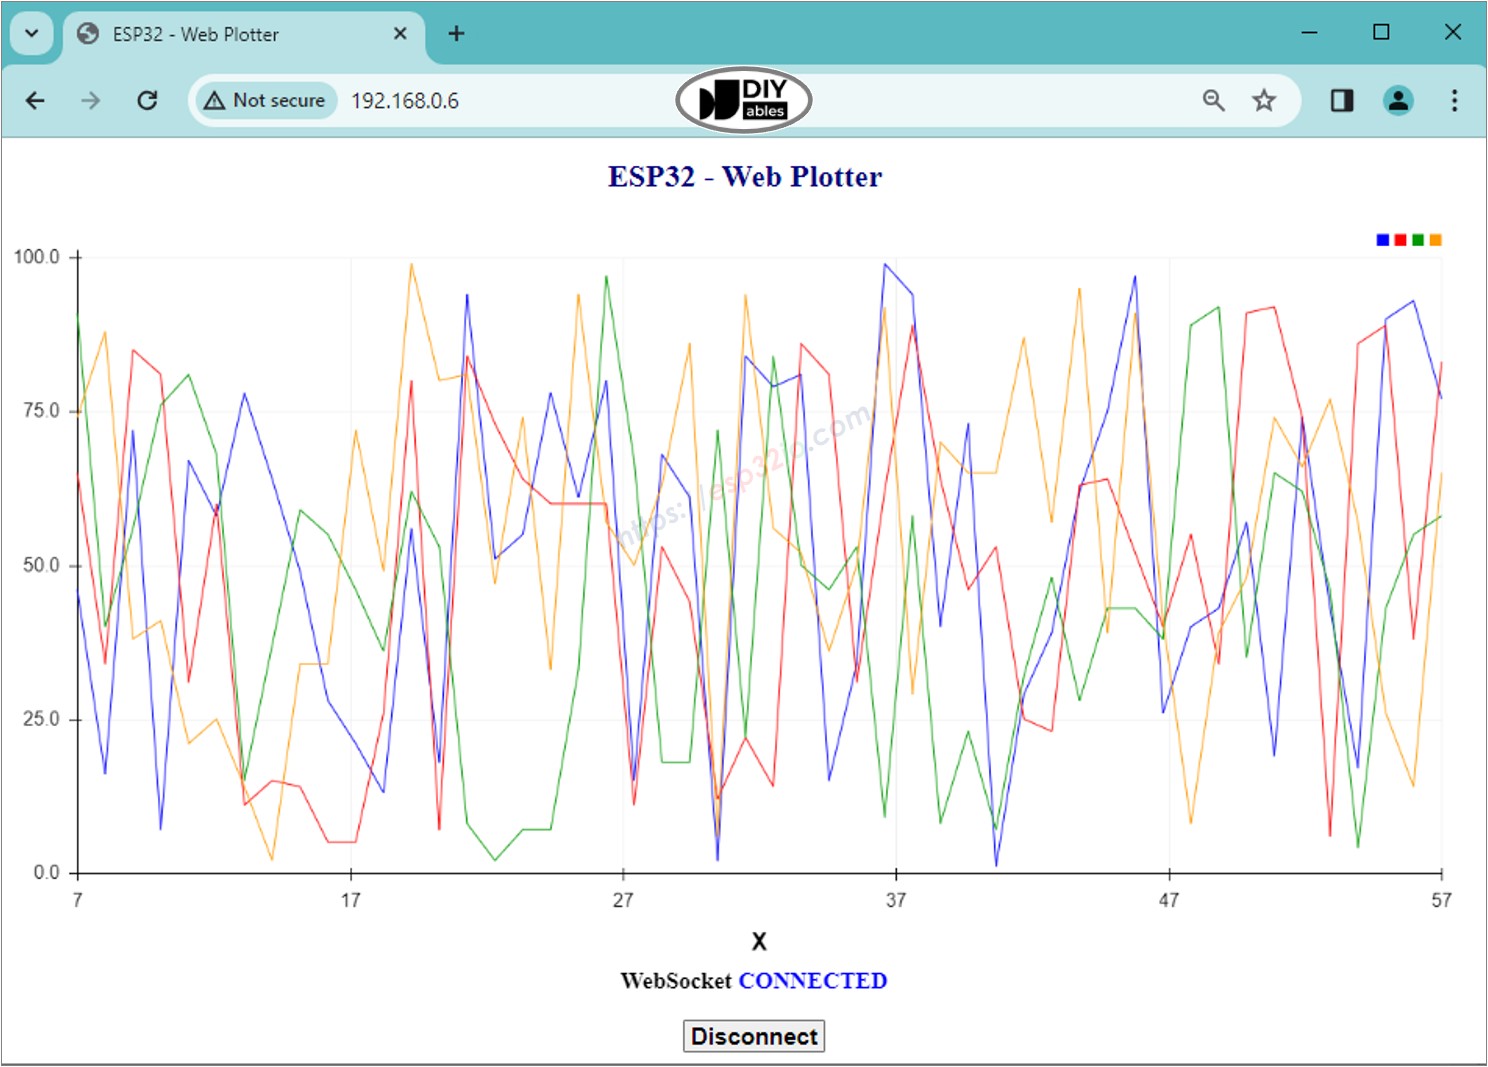
<h1 id="header">ESP32 - Web Plotter</h1>
<canvas id="graph"></canvas>
<br>
<div id="footer">
<div class="sub-footer">
<h2>WebSocket <span id="ws_state"><span style="color: gray">CLOSED</span></span></h2>
</div>
<button id="bt_connect" type="button" onclick="connect_onclick();">Connect</button>
</div>
</body>
</html>
)=====";
Code ESP32 ở trên chứa giải thích từng dòng. Vui lòng đọc các comment trong code!
 English for KidsHọc tiếng Anh vui nhộn cho trẻ nhỏ.Tải về trênGoogle PlayTải về trênApp Store
 Bubble NoteGhi chú tự xóa — viết như nhắn tin.Tải về trênGoogle PlayTải về trênApp Store
 Tôi Không MuaĐánh bại mua sắm bốc đồng, tiết kiệm hơn.Tải về trênGoogle PlayTải về trênApp Store
 Con Đường Tri ThứcBài thi thử để học mọi thứ.Tải về trênGoogle PlayTải về trênApp Store